 undefined
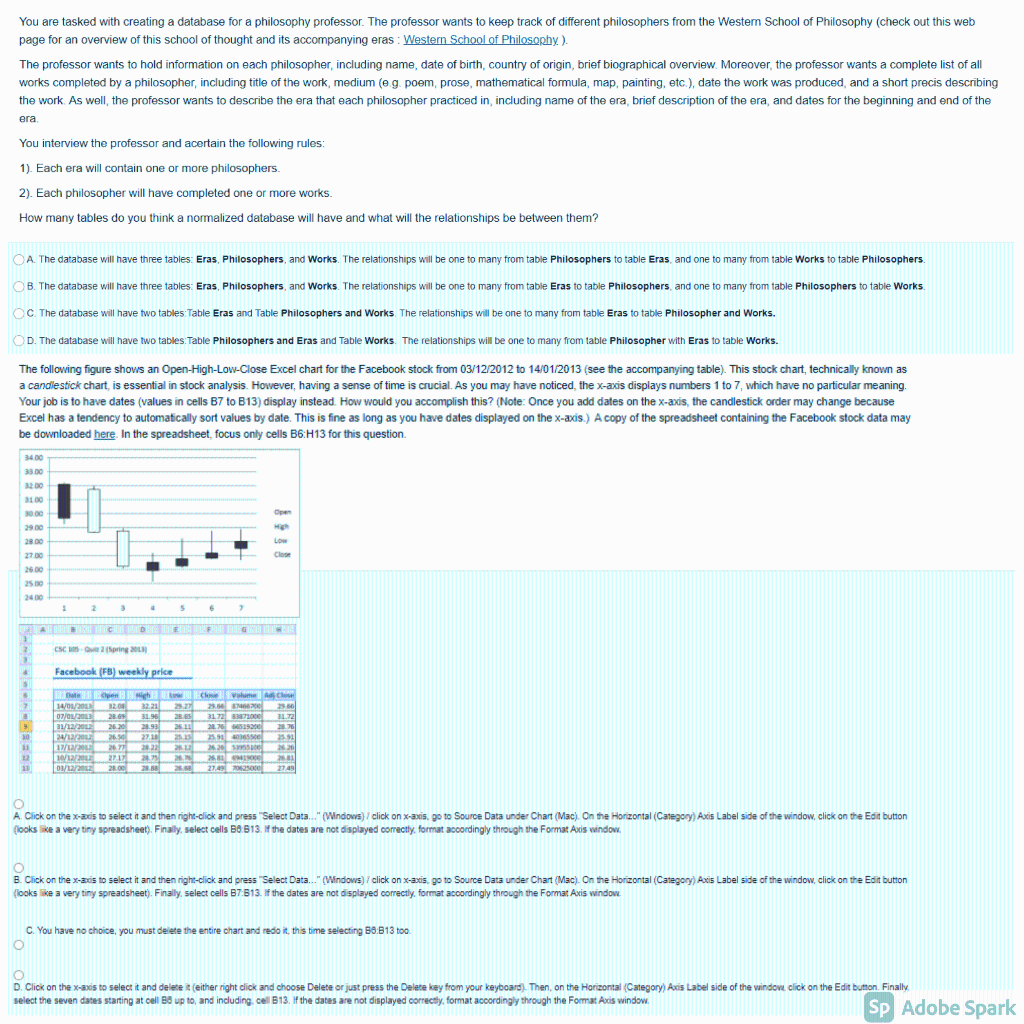
You are tasked with creating a database for a philosophy professor. The professor wants to keep track of different philosophers from the Westem School of Philosophy (check out this web page for an overview of this school of thought and its accompanying eras: Western School of Philosophy.). The professor wants to hold information on each philosopher, including name, date of birth, country of origin, brief biographical overview. Moreover, the professor wants a complete list of all works completed by a philosopher, including title of the work, medium (eg poem, prose, mathematical formula, map, painting, etc.), date the work was produced and a short precis describing the work. As well, the professor wants to describe the era that each philosopher practiced in, including name of the era, brief description of the era, and dates for the beginning and end of the era You interview the professor and acertain the following rules: 1). Each era will contain one or more philosophers. 2). Each philosopher will have completed one or more works. How many tables do you think a normalized database will have and what will the relationships be between them? OA. The database will have three tables: Eras, Philosophers, and Works. The relationships will be one to many from table Philosophers to table Eras, and one to many from table Works to table Philosophers OB. The database will have three tables Eras, Philosophers, and Works. The relationships will be one to many from table Eras to table Philosophers, and one to many from table Philosophers to table Works OC The database will have two tables Table Eras and Table Philosophers and Works The relationships will be one to many from table Eras to table Philosopher and Works. OD. The database will have two tables: Table Philosophers and Eras and Table Works. The relationships will be one to many from table Philosopher with Erasto table Works The following figure shows an Open-High-Low-Close Excel chart for the Facebook stock from 03/12/2012 to 14/01/2013 see the accompanying table). This stock chart, technically known as a candlestick chart, is essential in stock analysis. However, having a sense of time is crucial. As you may have noticed, the x-axis displays numbers 1 to 7, which have no particular meaning. Your job is to have dates (values in cells B7 to 513) display instead. How would you accomplish this? (Note: Once you add dates on the x-axis, the candlestick order may change because Excel has a tendency to automatically sort values by date. This is fine as long as you have dates displayed on the x-axis.) A copy of the spreadsheet containing the Facebook stock data may be downloaded here. In the spreadsheet, focus only cells B6:H13 for this question. Open 33.00 32.00 3100 000 29.00 28 00 27.00 2600 25.00 Hig LOW Close - 1 5 6 7 ABC D ESTFIGHTER CSC Spring 2018 2 3 Facebook (FB) weekly price 5 9 10 11 22 Il che Woch 14/01/2013 3200 1221 23.56 23.60 07/01/2018 28.00 31.96 3172 33872000 21.72 31/12/2011 2620 28.93 2511 20.7669200 2070 24/12/2016 27.10 23 25.325.50 267 20 26.26 2020 10/12/202 203 25. 2001 03/12/2012 28.00 20.00 27.4970925000 27.49 A. Click on the x-acs to select it and then right-click and press Select Data.." (Windows) / click on X-axis, go to Source Data under Chart (Mac). On the Horizontal (Category) Axis Label side of the window, click on the Edit button looks like a very tiny spreadsheet). Finally, select cells 80.613. If the dates are not displayed correctly, format accordingly through the Format Axis window O B. Click on the x-acs to select it and then right-click and press "Select Data.." (Windows) / click on x-axis, go to Source Data under Chart (Mac). On the Horizontal (Category) Axis Label side of the window, click on the Edit button looks like a very tiny spreadsheet). Finally, select cells 87.813. If the dates are not displayed correctly, format accordingly through the Format Axis window C. You have no choice, you must delete the entire chart and redo it, this time selecting 86:813 too to D. Click on the x-axis to select it and delete it (either right click and choose Delete or just press the Delete key from your keyboard). Then, on the Horizontal (Category) Axis Label side of the window, click on the Edit button. Finally, select the seven dates starting at cell Be up to, and including cell B13. If the dates are not displayed correctly, format accordingly through the Format Acis window Sp Adobe Spark You are tasked with creating a database for a philosophy professor. The professor wants to keep track of different philosophers from the Westem School of Philosophy (check out this web page for an overview of this school of thought and its accompanying eras: Western School of Philosophy.). The professor wants to hold information on each philosopher, including name, date of birth, country of origin, brief biographical overview. Moreover, the professor wants a complete list of all works completed by a philosopher, including title of the work, medium (eg poem, prose, mathematical formula, map, painting, etc.), date the work was produced and a short precis describing the work. As well, the professor wants to describe the era that each philosopher practiced in, including name of the era, brief description of the era, and dates for the beginning and end of the era You interview the professor and acertain the following rules: 1). Each era will contain one or more philosophers. 2). Each philosopher will have completed one or more works. How many tables do you think a normalized database will have and what will the relationships be between them? OA. The database will have three tables: Eras, Philosophers, and Works. The relationships will be one to many from table Philosophers to table Eras, and one to many from table Works to table Philosophers OB. The database will have three tables Eras, Philosophers, and Works. The relationships will be one to many from table Eras to table Philosophers, and one to many from table Philosophers to table Works OC The database will have two tables Table Eras and Table Philosophers and Works The relationships will be one to many from table Eras to table Philosopher and Works. OD. The database will have two tables: Table Philosophers and Eras and Table Works. The relationships will be one to many from table Philosopher with Erasto table Works The following figure shows an Open-High-Low-Close Excel chart for the Facebook stock from 03/12/2012 to 14/01/2013 see the accompanying table). This stock chart, technically known as a candlestick chart, is essential in stock analysis. However, having a sense of time is crucial. As you may have noticed, the x-axis displays numbers 1 to 7, which have no particular meaning. Your job is to have dates (values in cells B7 to 513) display instead. How would you accomplish this? (Note: Once you add dates on the x-axis, the candlestick order may change because Excel has a tendency to automatically sort values by date. This is fine as long as you have dates displayed on the x-axis.) A copy of the spreadsheet containing the Facebook stock data may be downloaded here. In the spreadsheet, focus only cells B6:H13 for this question. Open 33.00 32.00 3100 000 29.00 28 00 27.00 2600 25.00 Hig LOW Close - 1 5 6 7 ABC D ESTFIGHTER CSC Spring 2018 2 3 Facebook (FB) weekly price 5 9 10 11 22 Il che Woch 14/01/2013 3200 1221 23.56 23.60 07/01/2018 28.00 31.96 3172 33872000 21.72 31/12/2011 2620 28.93 2511 20.7669200 2070 24/12/2016 27.10 23 25.325.50 267 20 26.26 2020 10/12/202 203 25. 2001 03/12/2012 28.00 20.00 27.4970925000 27.49 A. Click on the x-acs to select it and then right-click and press Select Data.." (Windows) / click on X-axis, go to Source Data under Chart (Mac). On the Horizontal (Category) Axis Label side of the window, click on the Edit button looks like a very tiny spreadsheet). Finally, select cells 80.613. If the dates are not displayed correctly, format accordingly through the Format Axis window O B. Click on the x-acs to select it and then right-click and press "Select Data.." (Windows) / click on x-axis, go to Source Data under Chart (Mac). On the Horizontal (Category) Axis Label side of the window, click on the Edit button looks like a very tiny spreadsheet). Finally, select cells 87.813. If the dates are not displayed correctly, format accordingly through the Format Axis window C. You have no choice, you must delete the entire chart and redo it, this time selecting 86:813 too to D. Click on the x-axis to select it and delete it (either right click and choose Delete or just press the Delete key from your keyboard). Then, on the Horizontal (Category) Axis Label side of the window, click on the Edit button. Finally, select the seven dates starting at cell Be up to, and including cell B13. If the dates are not displayed correctly, format accordingly through the Format Acis window Sp Adobe Spark