Under Armours Turnaround Strategy in 2018: Efforts to Revive North American Sales and Profitability
*Analysis of UA's financial performance from ROA, gross profit margin, Current ratio
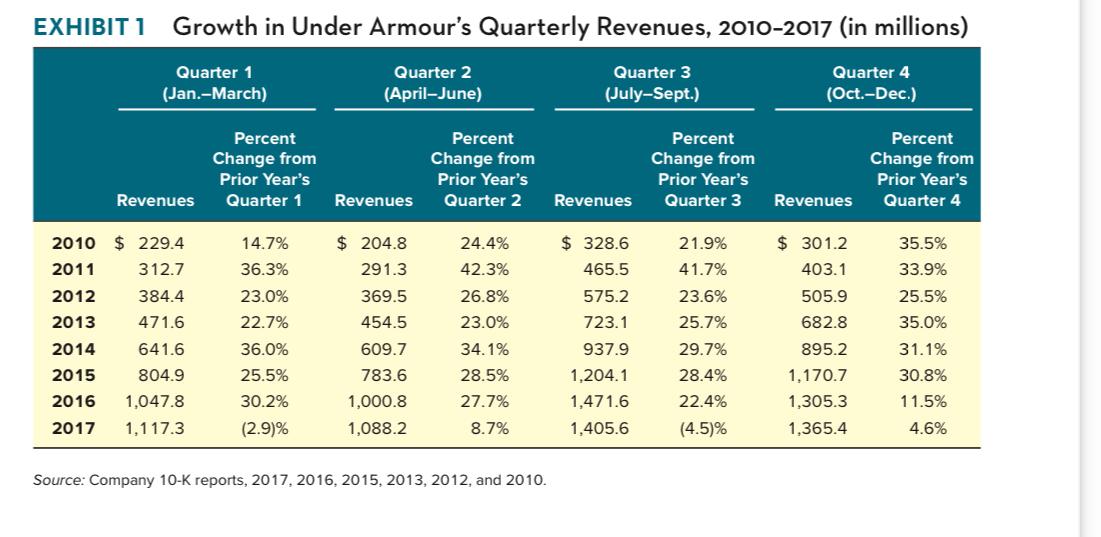
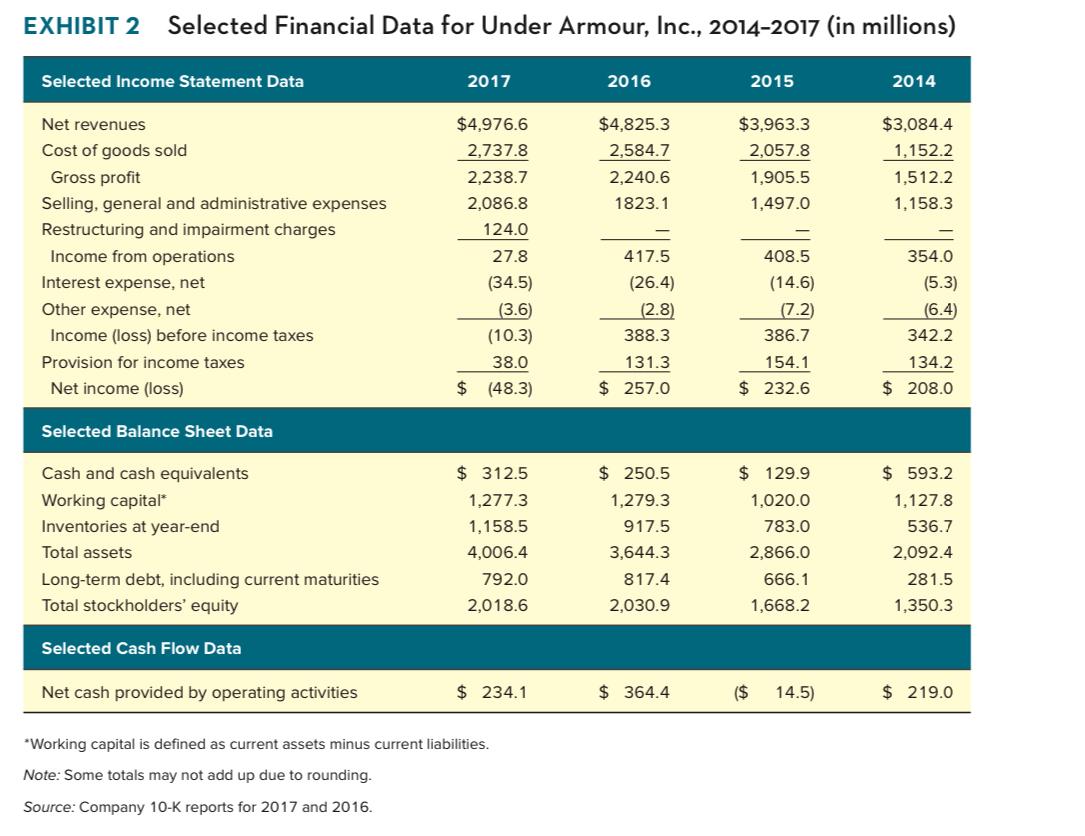
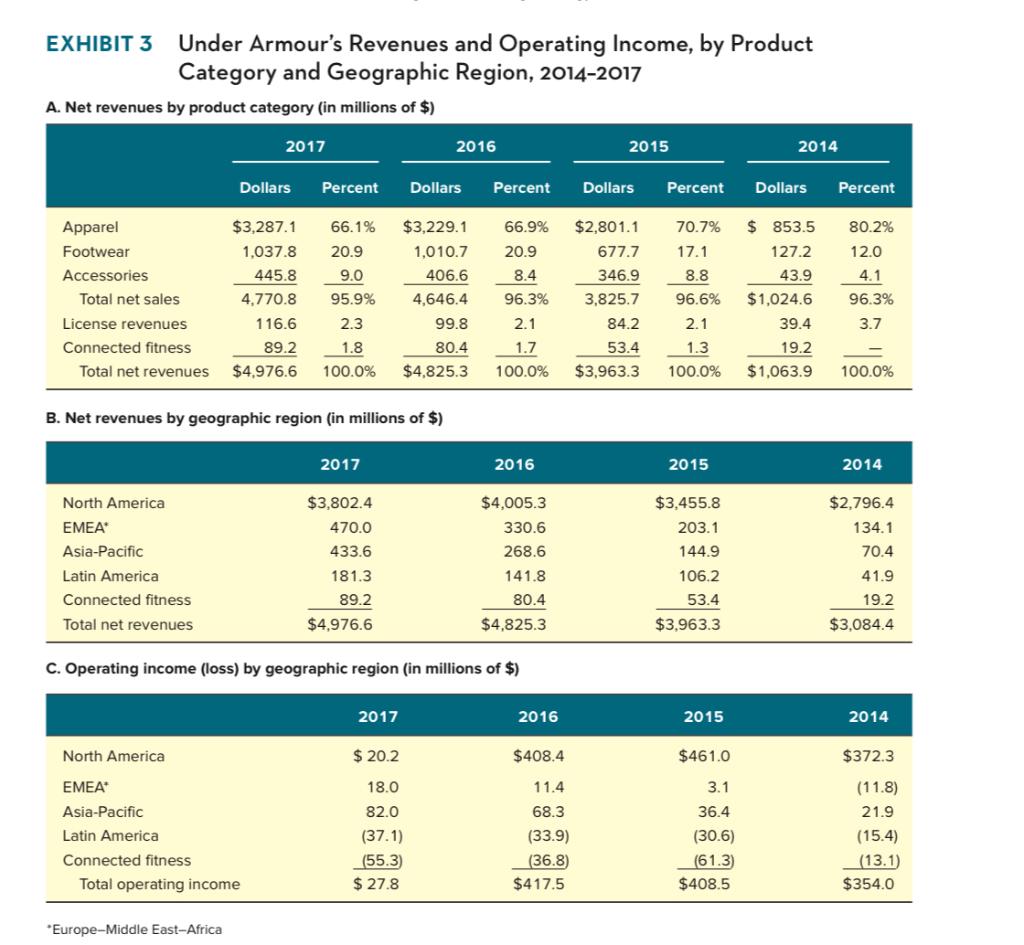
EXHIBIT 1 Growth in Under Armour's Quarterly Revenues, 2010-2017 (in millions) Quarter 1 (Jan.-March) Quarter 2 (April-June) Quarter 3 (July-Sept.) Quarter 4 (Oct.-Dec.) Percent Change from Prior Year's Quarter 1 Percent Change from Prior Year's Quarter 2 Percent Change from Prior Year's Quarter 3 Percent Change from Prior Year's Quarter 4 Revenues Revenues Revenues Revenues 14.7% $ 328.6 465.5 2010 $ 229.4 2011 312.7 2012 384.4 2013 $ 204.8 291.3 369.5 454.5 $ 301.2 403.1 505.9 682.8 35.5% 33.9% 25.5% 35.0% 575.2 723.1 471.6 24.4% 42.3% 26.8% 23.0% 34.1% 28.5% 27.7% 8.7% 21.9% 41.7% 23.6% 25.7% 29.7% 28.4% 22.4% (4.5)% 36.3% 23.0% 22.7% 36.0% 25.5% 30.2% (2.9)% 641.6 2014 2015 2016 2017 804.9 609.7 783.6 1,000.8 1,088.2 937.9 1,204.1 1,471.6 1,405.6 895.2 1,170.7 1,305.3 1,365.4 31.1% 30.8% 11.5% 4.6% 1,047.8 1,117.3 Source: Company 10-K reports, 2017, 2016, 2015, 2013, 2012, and 2010. EXHIBIT 2 Selected Financial Data for Under Armour, Inc., 2014-2017 (in millions) Selected Income Statement Data 2017 2016 2015 2014 $4,976.6 2,737.8 2,238.7 2,086.8 $4,825.3 2,584.7 2.240.6 $3,963.3 2,057.8 1,905.5 1,497.0 $3,084.4 1,152.2 1,512.2 1,158.3 1823.1 124.0 Net revenues Cost of goods sold Gross profit Selling, general and administrative expenses Restructuring and impairment charges Income from operations Interest expense, net Other expense, net Income (loss) before income taxes Provision for income taxes Net income (loss) 27.8 (34.5) (3.6) (10.3) 38.0 $ (48.3) 417.5 (26.4) (2.8) 388.3 131.3 $ 257.0 408.5 (14.6) (7.2) 386.7 154.1 $ 232.6 354.0 (5.3) (6.4 342.2 134.2 $ 208.0 Selected Balance Sheet Data $ 129.9 Cash and cash equivalents Working capital* Inventories at year-end Total assets Long-term debt, including current maturities Total stockholders' equity $ 3125 1,277.3 1,158.5 4,006.4 792.0 2,018.6 $ 250.5 1,279.3 917.5 3,644.3 1,020.0 783.0 2,866.0 666.1 1,668.2 $ 593.2 1,127.8 536.7 2,092.4 281.5 1,350.3 817.4 2,030.9 Selected Cash Flow Data Net cash provided by operating activities $ 234.1 $ 364.4 ($ 14.5) $ 219.0 Working capital is defined as current assets minus current liabilities. Note: Some totals may not add up due to rounding. Source: Company 10-K reports for 2017 and 2016. EXHIBIT 3 Under Armour's Revenues and Operating Income, by Product Category and Geographic Region, 2014-2017 A. Net revenues by product category (in millions of $) 2017 2016 2015 2014 Dollars Percent Dollars Percent Dollars Percent Dollars Percent $3,287.1 66.9% 20.9 Apparel Footwear Accessories Total net sales 66.1% 20.9 9.0 95.9% 2.3 1.8 100.0% 1,037.8 445.8 4.770.8 116.6 89.2 $4,976.6 $3,229.1 1,010.7 406.6 4,646.4 99.8 80.4 $4,825.3 70.7% 17.1 8.8 96.6% $2,801.1 677.7 346.9 3,825.7 84.2 53.4 $3,963.3 8.4 96.3% 2.1 $ 853.5 127.2 43.9 $1,024.6 39.4 19.2 $1,063.9 80.2% 12.0 4.1 96.3% 3.7 License revenues Connected fitness 1.7 2.1 1.3 100.0% Total net revenues 100.0% 100.0% B. Net revenues by geographic region (in millions of $) 2017 2016 2015 2014 North America EMEA Asia-Pacific Latin America Connected fitness $4,005.3 330.6 268.6 $3,802.4 470.0 433.6 181.3 89.2 $4,976.6 $3,455.8 203.1 144.9 106.2 53.4 $3,963.3 $2,796.4 134.1 70.4 41.9 19.2 $3,084.4 141.8 80.4 $4,825.3 Total net revenues C. Operating income (loss) by geographic region (in millions of $) 2017 2016 2015 2014 North America $ 20.2 $408.4 $461.0 $372.3 18.0 11.4 3.1 EMEA Asia-Pacific Latin America Connected fitness Total operating income 82.0 (37.1) (55.3) $ 27.8 68.3 (33.9) (36.8) $417.5 36.4 (30.6) (61.3) $408.5 (11.8) 21.9 (15.4) (13.1) $354.0 *Europe Middle East-Africa EXHIBIT 1 Growth in Under Armour's Quarterly Revenues, 2010-2017 (in millions) Quarter 1 (Jan.-March) Quarter 2 (April-June) Quarter 3 (July-Sept.) Quarter 4 (Oct.-Dec.) Percent Change from Prior Year's Quarter 1 Percent Change from Prior Year's Quarter 2 Percent Change from Prior Year's Quarter 3 Percent Change from Prior Year's Quarter 4 Revenues Revenues Revenues Revenues 14.7% $ 328.6 465.5 2010 $ 229.4 2011 312.7 2012 384.4 2013 $ 204.8 291.3 369.5 454.5 $ 301.2 403.1 505.9 682.8 35.5% 33.9% 25.5% 35.0% 575.2 723.1 471.6 24.4% 42.3% 26.8% 23.0% 34.1% 28.5% 27.7% 8.7% 21.9% 41.7% 23.6% 25.7% 29.7% 28.4% 22.4% (4.5)% 36.3% 23.0% 22.7% 36.0% 25.5% 30.2% (2.9)% 641.6 2014 2015 2016 2017 804.9 609.7 783.6 1,000.8 1,088.2 937.9 1,204.1 1,471.6 1,405.6 895.2 1,170.7 1,305.3 1,365.4 31.1% 30.8% 11.5% 4.6% 1,047.8 1,117.3 Source: Company 10-K reports, 2017, 2016, 2015, 2013, 2012, and 2010. EXHIBIT 2 Selected Financial Data for Under Armour, Inc., 2014-2017 (in millions) Selected Income Statement Data 2017 2016 2015 2014 $4,976.6 2,737.8 2,238.7 2,086.8 $4,825.3 2,584.7 2.240.6 $3,963.3 2,057.8 1,905.5 1,497.0 $3,084.4 1,152.2 1,512.2 1,158.3 1823.1 124.0 Net revenues Cost of goods sold Gross profit Selling, general and administrative expenses Restructuring and impairment charges Income from operations Interest expense, net Other expense, net Income (loss) before income taxes Provision for income taxes Net income (loss) 27.8 (34.5) (3.6) (10.3) 38.0 $ (48.3) 417.5 (26.4) (2.8) 388.3 131.3 $ 257.0 408.5 (14.6) (7.2) 386.7 154.1 $ 232.6 354.0 (5.3) (6.4 342.2 134.2 $ 208.0 Selected Balance Sheet Data $ 129.9 Cash and cash equivalents Working capital* Inventories at year-end Total assets Long-term debt, including current maturities Total stockholders' equity $ 3125 1,277.3 1,158.5 4,006.4 792.0 2,018.6 $ 250.5 1,279.3 917.5 3,644.3 1,020.0 783.0 2,866.0 666.1 1,668.2 $ 593.2 1,127.8 536.7 2,092.4 281.5 1,350.3 817.4 2,030.9 Selected Cash Flow Data Net cash provided by operating activities $ 234.1 $ 364.4 ($ 14.5) $ 219.0 Working capital is defined as current assets minus current liabilities. Note: Some totals may not add up due to rounding. Source: Company 10-K reports for 2017 and 2016. EXHIBIT 3 Under Armour's Revenues and Operating Income, by Product Category and Geographic Region, 2014-2017 A. Net revenues by product category (in millions of $) 2017 2016 2015 2014 Dollars Percent Dollars Percent Dollars Percent Dollars Percent $3,287.1 66.9% 20.9 Apparel Footwear Accessories Total net sales 66.1% 20.9 9.0 95.9% 2.3 1.8 100.0% 1,037.8 445.8 4.770.8 116.6 89.2 $4,976.6 $3,229.1 1,010.7 406.6 4,646.4 99.8 80.4 $4,825.3 70.7% 17.1 8.8 96.6% $2,801.1 677.7 346.9 3,825.7 84.2 53.4 $3,963.3 8.4 96.3% 2.1 $ 853.5 127.2 43.9 $1,024.6 39.4 19.2 $1,063.9 80.2% 12.0 4.1 96.3% 3.7 License revenues Connected fitness 1.7 2.1 1.3 100.0% Total net revenues 100.0% 100.0% B. Net revenues by geographic region (in millions of $) 2017 2016 2015 2014 North America EMEA Asia-Pacific Latin America Connected fitness $4,005.3 330.6 268.6 $3,802.4 470.0 433.6 181.3 89.2 $4,976.6 $3,455.8 203.1 144.9 106.2 53.4 $3,963.3 $2,796.4 134.1 70.4 41.9 19.2 $3,084.4 141.8 80.4 $4,825.3 Total net revenues C. Operating income (loss) by geographic region (in millions of $) 2017 2016 2015 2014 North America $ 20.2 $408.4 $461.0 $372.3 18.0 11.4 3.1 EMEA Asia-Pacific Latin America Connected fitness Total operating income 82.0 (37.1) (55.3) $ 27.8 68.3 (33.9) (36.8) $417.5 36.4 (30.6) (61.3) $408.5 (11.8) 21.9 (15.4) (13.1) $354.0 *Europe Middle East-Africa