Under the assumptions that Ideko's market share will increase by 0.45 percent per year (implying that the investment, financing, and depreciation will be adjusted accordingly) and the following forecasts, calculate Ideko's working capital requirements through 2010 (that is, reproduce Table 19.9 under the new assumptions). Ideko's pro-forma income statements for 2005-2010 are shown here, while its balance sheet for 2005 is shown here
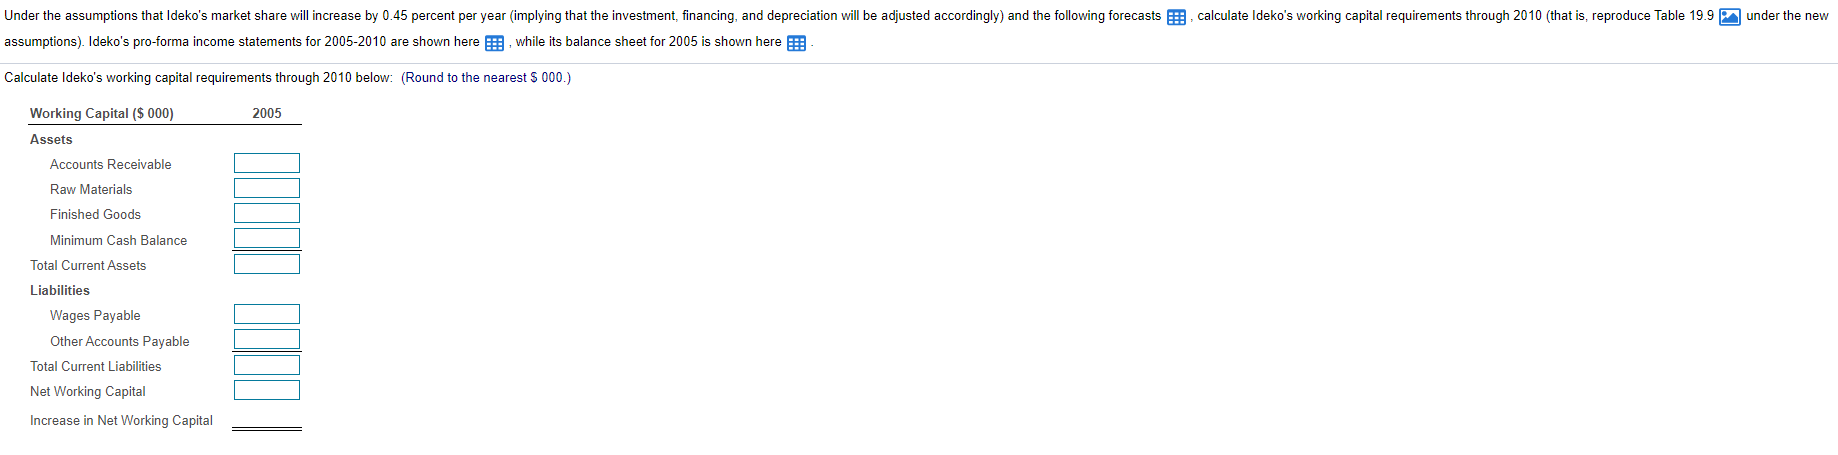
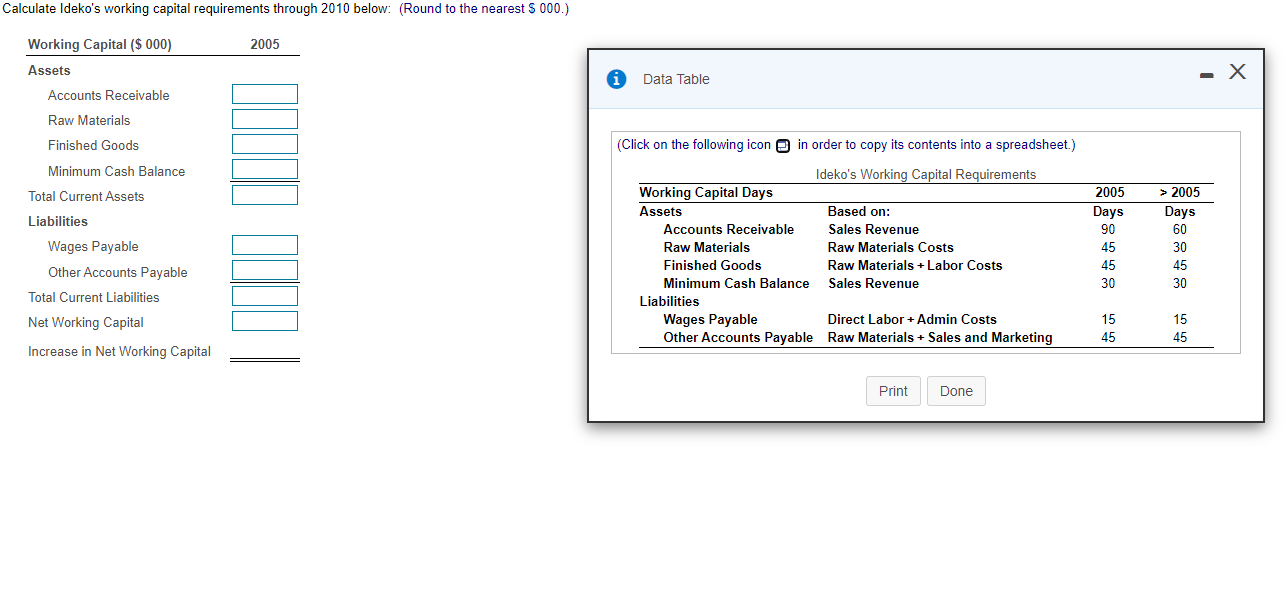
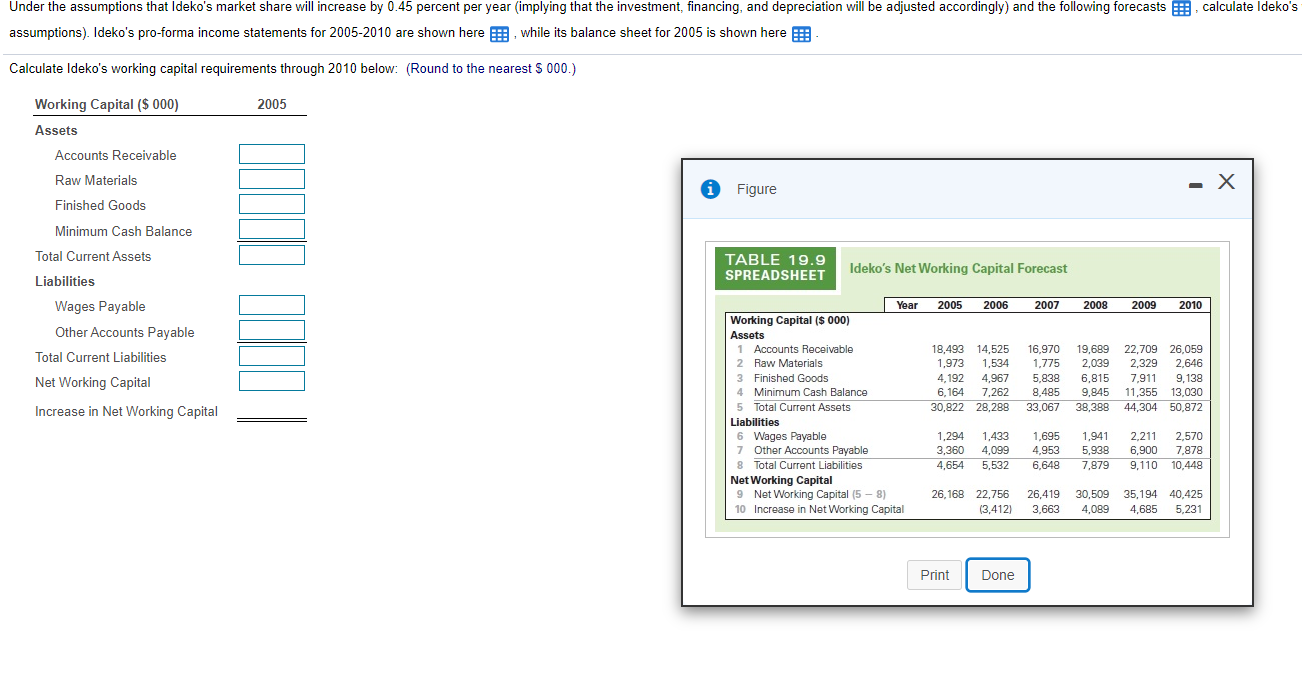
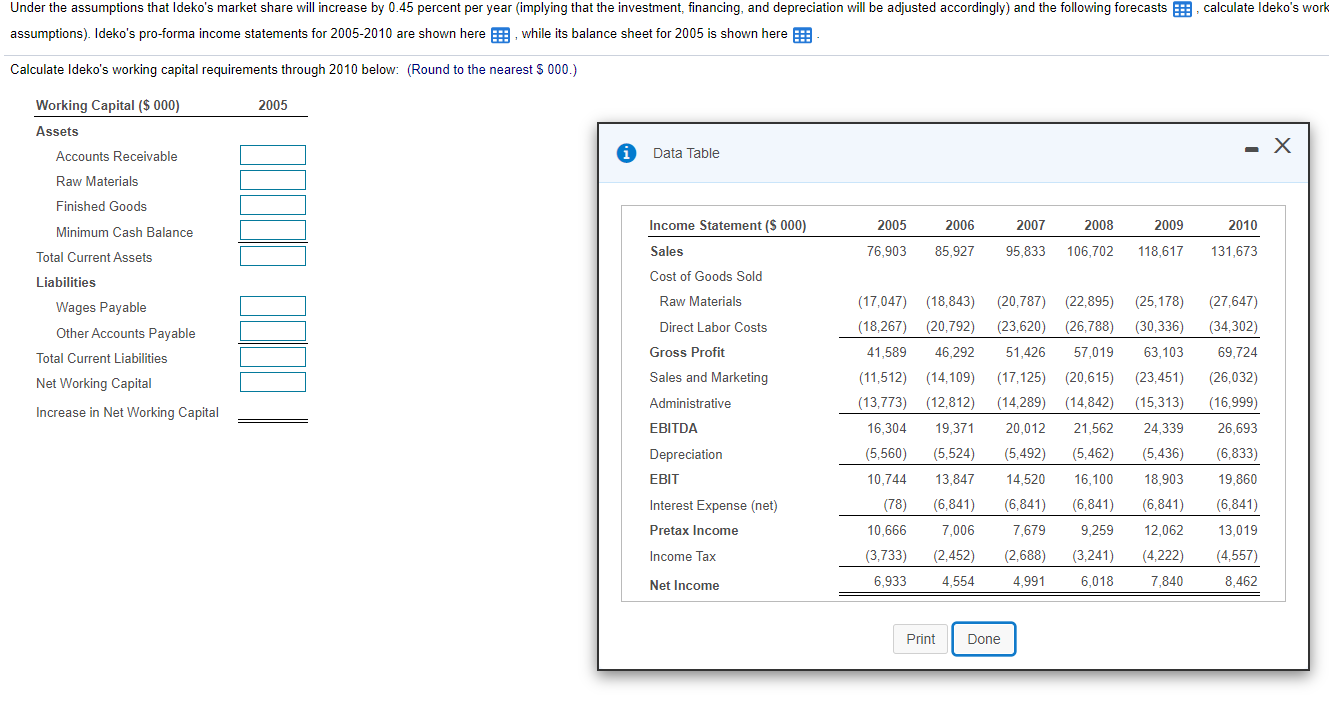
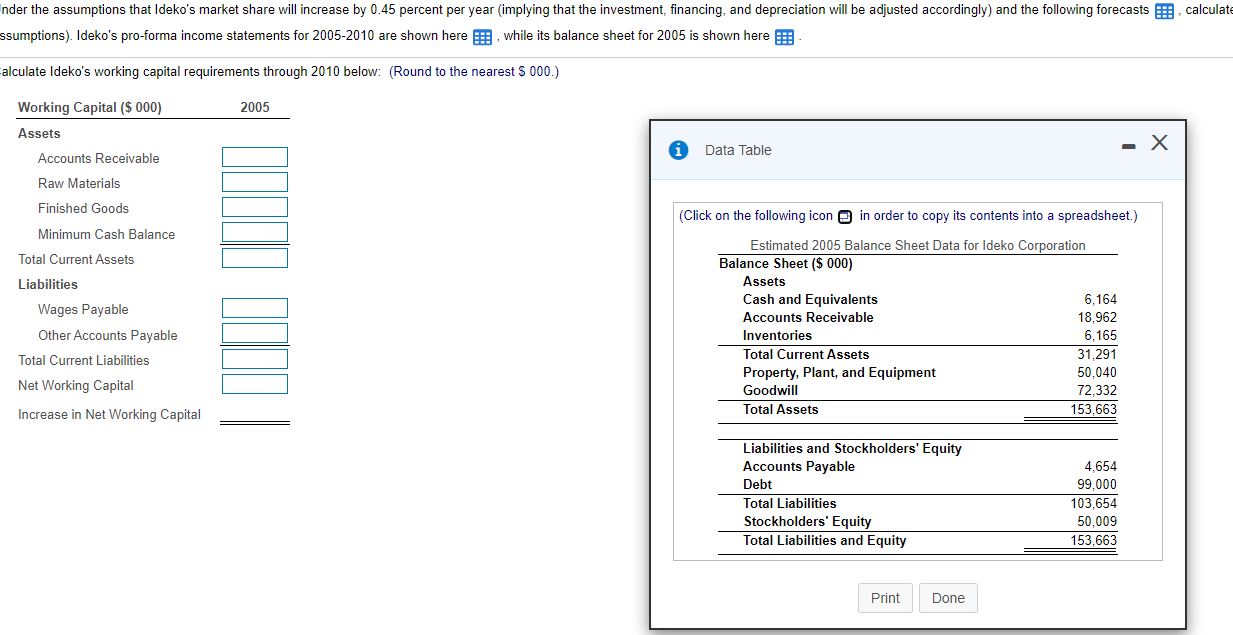
Under the assumptions that Ideko's market share will increase by 0.45 percent per year (implying that the investment, financing, and depreciation will be adjusted accordingly) and the following forecasts calculate Ideko's working capital requirements through 2010 (that is, reproduce Table 19.9 under the new assumptions). Ideko's pro-forma income statements for 2005-2010 are shown here , while its balance sheet for 2005 is shown here Calculate Ideko's working capital requirements through 2010 below: (Round to the nearest S 000.) Working Capital ($ 000) 2005 Assets Accounts Receivable Raw Materials Finished Goods Minimum Cash Balance Total Current Assets Liabilities Wages Payable Other Accounts Payable Total Current Liabilities Net Working Capital Increase in Net Working Capital Calculate Ideko's working capital requirements through 2010 below: (Round to the nearest S 000.) Working Capital ($ 000) 2005 Assets Data Table Accounts Receivable Raw Materials Finished Goods (Click on the following icon in order to copy its contents into a spreadsheet.) Minimum Cash Balance Total Current Assets Liabilities Wages Payable Other Accounts Payable Total Current Liabilities Net Working Capital Ideko's Working Capital Requirements Working Capital Days Assets Based on: Accounts Receivable Sales Revenue Raw Materials Raw Materials Costs Finished Goods Raw Materials +Labor Costs Minimum Cash Balance Sales Revenue Liabilities Wages Payable Direct Labor+Admin Costs Other Accounts Payable Raw Materials + Sales and Marketing 2005 Days 90 45 45 30 > 2005 Days 60 30 45 30 15 45 15 45 Increase in Net Working Capital Print Done Under the assumptions that Ideko's market share will increase by 0.45 percent per year (implying that the investment, financing, and depreciation will be adjusted accordingly) and the following forecasts 3, calculate Ideko's assumptions). Ideko's pro-forma income statements for 2005-2010 are shown here while its balance sheet for 2005 is shown here : Calculate Ideko's working capital requirements through 2010 below: (Round to the nearest S 000.) 2005 Working Capital ($ 000) Assets Accounts Receivable Raw Materials A Figure - X Finished Goods TABLE 19.9 SPREADSHEET Ideko's Net Working Capital Forecast Minimum Cash Balance Total Current Assets Liabilities Wages Payable Other Accounts Payable Total Current Liabilities Net Working Capital 2005 2006 2007 2008 2009 2010 Year Working Capital ($ 000) Assets 1 Accounts Receivable 2 Raw Materials 3 Finished Goods 4 Minimum Cash Balance 5 Total Current Assets Liabilities 6 Wages Payable 7 Other Accounts Payable 8 Total Current Liabilities Net Working Capital 9 Net Working Capital (5-8) 10 Increase in Net Working Capital 18,493 14,525 1,973 1,534 4,192 4,967 6,164 7,262 30,822 28,288 16,970 1,775 5,838 8,485 33,067 19.689 2,039 6,815 9,845 38,388 22,709 26,059 2,329 2,646 7,911 9,138 11,355 13.030 44,304 50.872 Increase in Net Working Capital 1,294 3,360 4.654 1,433 4,099 5,532 1,695 4,953 6,648 1,941 5,938 7,879 2,211 6,900 9,110 2,570 7.878 10,448 26,168 22.756 (3,412) 26,419 3,663 30.509 4,089 35,194 40,425 4,685 5,231 Print Done Under the assumptions that Ideko's market share will increase by 0.45 percent per year (implying that the investment, financing, and depreciation will be adjusted accordingly) and the following forecasts , calculate Ideko's work assumptions). Ideko's pro-forma income statements for 2005-2010 are shown here while its balance sheet for 2005 is shown here Calculate Ideko's working capital requirements through 2010 below: (Round to the nearest 5 000.) 2005 Working Capital ($ 000) Assets - X Accounts Receivable Data Table Raw Materials Finished Goods 2005 2006 2007 2008 2009 2010 Minimum Cash Balance Total Current Assets Income Statement ($ 000) Sales 76,903 85,927 95,833 106,702 118,617 131,673 Cost of Goods Sold Raw Materials Liabilities Wages Payable Other Accounts Payable Total Current Liabilities Net Working Capital Increase in Net Working Capital (22,895) (26,788) (18,843) (20,792) 46,292 Direct Labor Costs Gross Profit Sales and Marketing (17,047) (18,267) 41,589 (11,512) (13,773) 16,304 (20,787) (23,620) 51,426 (17,125) (14,289) (27,647) (34,302) 69,724 (25,178) (30,336) 63,103 (23,451) (15,313) 57,019 (20,615) (14,842) (14,109) (12,812) (26,032) Administrative (16,999) EBITDA 19.371 20,012 21,562 24,339 26,693 (5,492) (5.462) (5,436) Depreciation EBIT (5,560) 10.744 (5,524) 13,847 14,520 16.100 18,903 (6,833) 19,860 (6,841) Interest Expense (net) (6,841) (6,841) (78) 10.666 (6,841) 7,679 (6,841) 9.259 Pretax Income 7.006 12.062 13,019 Income Tax (2,452) (4.222) (3,733) 6,933 (2,688) 4,991 (3,241) 6,018 (4,557) 8,462 Net Income 4,554 7,840 Print Done nder the assumptions that Ideko's market share will increase by 0.45 percent per year implying that the investment, financing, and depreciation will be adjusted accordingly) and the following forecasts calculate ssumptions). Ideko's pro-forma income statements for 2005-2010 are shown here while its balance sheet for 2005 is shown here : alculate Ideko's working capital requirements through 2010 below: (Round to the nearest $ 000.) 2005 Working Capital ($ 000) Assets Data Table Accounts Receivable Raw Materials (Click on the following icon in order to copy its contents into a spreadsheet.) Finished Goods Minimum Cash Balance Total Current Assets Liabilities Wages Payable Other Accounts Payable Total Current Liabilities Net Working Capital Increase in Net Working Capital Estimated 2005 Balance Sheet Data for Ideko Corporation Balance Sheet ($ 000) Assets Cash and Equivalents 6.164 Accounts Receivable 18,962 Inventories 6,165 Total Current Assets 31,291 Property, Plant, and Equipment 50,040 Goodwill 72,332 Total Assets 153,663 Liabilities and Stockholders' Equity Accounts Payable Debt Total Liabilities Stockholders' Equity Total Liabilities and Equity 4,654 99,000 103.654 50,009 153,663 Print Done Under the assumptions that Ideko's market share will increase by 0.45 percent per year (implying that the investment, financing, and depreciation will be adjusted accordingly) and the following forecasts calculate Ideko's working capital requirements through 2010 (that is, reproduce Table 19.9 under the new assumptions). Ideko's pro-forma income statements for 2005-2010 are shown here , while its balance sheet for 2005 is shown here Calculate Ideko's working capital requirements through 2010 below: (Round to the nearest S 000.) Working Capital ($ 000) 2005 Assets Accounts Receivable Raw Materials Finished Goods Minimum Cash Balance Total Current Assets Liabilities Wages Payable Other Accounts Payable Total Current Liabilities Net Working Capital Increase in Net Working Capital Calculate Ideko's working capital requirements through 2010 below: (Round to the nearest S 000.) Working Capital ($ 000) 2005 Assets Data Table Accounts Receivable Raw Materials Finished Goods (Click on the following icon in order to copy its contents into a spreadsheet.) Minimum Cash Balance Total Current Assets Liabilities Wages Payable Other Accounts Payable Total Current Liabilities Net Working Capital Ideko's Working Capital Requirements Working Capital Days Assets Based on: Accounts Receivable Sales Revenue Raw Materials Raw Materials Costs Finished Goods Raw Materials +Labor Costs Minimum Cash Balance Sales Revenue Liabilities Wages Payable Direct Labor+Admin Costs Other Accounts Payable Raw Materials + Sales and Marketing 2005 Days 90 45 45 30 > 2005 Days 60 30 45 30 15 45 15 45 Increase in Net Working Capital Print Done Under the assumptions that Ideko's market share will increase by 0.45 percent per year (implying that the investment, financing, and depreciation will be adjusted accordingly) and the following forecasts 3, calculate Ideko's assumptions). Ideko's pro-forma income statements for 2005-2010 are shown here while its balance sheet for 2005 is shown here : Calculate Ideko's working capital requirements through 2010 below: (Round to the nearest S 000.) 2005 Working Capital ($ 000) Assets Accounts Receivable Raw Materials A Figure - X Finished Goods TABLE 19.9 SPREADSHEET Ideko's Net Working Capital Forecast Minimum Cash Balance Total Current Assets Liabilities Wages Payable Other Accounts Payable Total Current Liabilities Net Working Capital 2005 2006 2007 2008 2009 2010 Year Working Capital ($ 000) Assets 1 Accounts Receivable 2 Raw Materials 3 Finished Goods 4 Minimum Cash Balance 5 Total Current Assets Liabilities 6 Wages Payable 7 Other Accounts Payable 8 Total Current Liabilities Net Working Capital 9 Net Working Capital (5-8) 10 Increase in Net Working Capital 18,493 14,525 1,973 1,534 4,192 4,967 6,164 7,262 30,822 28,288 16,970 1,775 5,838 8,485 33,067 19.689 2,039 6,815 9,845 38,388 22,709 26,059 2,329 2,646 7,911 9,138 11,355 13.030 44,304 50.872 Increase in Net Working Capital 1,294 3,360 4.654 1,433 4,099 5,532 1,695 4,953 6,648 1,941 5,938 7,879 2,211 6,900 9,110 2,570 7.878 10,448 26,168 22.756 (3,412) 26,419 3,663 30.509 4,089 35,194 40,425 4,685 5,231 Print Done Under the assumptions that Ideko's market share will increase by 0.45 percent per year (implying that the investment, financing, and depreciation will be adjusted accordingly) and the following forecasts , calculate Ideko's work assumptions). Ideko's pro-forma income statements for 2005-2010 are shown here while its balance sheet for 2005 is shown here Calculate Ideko's working capital requirements through 2010 below: (Round to the nearest 5 000.) 2005 Working Capital ($ 000) Assets - X Accounts Receivable Data Table Raw Materials Finished Goods 2005 2006 2007 2008 2009 2010 Minimum Cash Balance Total Current Assets Income Statement ($ 000) Sales 76,903 85,927 95,833 106,702 118,617 131,673 Cost of Goods Sold Raw Materials Liabilities Wages Payable Other Accounts Payable Total Current Liabilities Net Working Capital Increase in Net Working Capital (22,895) (26,788) (18,843) (20,792) 46,292 Direct Labor Costs Gross Profit Sales and Marketing (17,047) (18,267) 41,589 (11,512) (13,773) 16,304 (20,787) (23,620) 51,426 (17,125) (14,289) (27,647) (34,302) 69,724 (25,178) (30,336) 63,103 (23,451) (15,313) 57,019 (20,615) (14,842) (14,109) (12,812) (26,032) Administrative (16,999) EBITDA 19.371 20,012 21,562 24,339 26,693 (5,492) (5.462) (5,436) Depreciation EBIT (5,560) 10.744 (5,524) 13,847 14,520 16.100 18,903 (6,833) 19,860 (6,841) Interest Expense (net) (6,841) (6,841) (78) 10.666 (6,841) 7,679 (6,841) 9.259 Pretax Income 7.006 12.062 13,019 Income Tax (2,452) (4.222) (3,733) 6,933 (2,688) 4,991 (3,241) 6,018 (4,557) 8,462 Net Income 4,554 7,840 Print Done nder the assumptions that Ideko's market share will increase by 0.45 percent per year implying that the investment, financing, and depreciation will be adjusted accordingly) and the following forecasts calculate ssumptions). Ideko's pro-forma income statements for 2005-2010 are shown here while its balance sheet for 2005 is shown here : alculate Ideko's working capital requirements through 2010 below: (Round to the nearest $ 000.) 2005 Working Capital ($ 000) Assets Data Table Accounts Receivable Raw Materials (Click on the following icon in order to copy its contents into a spreadsheet.) Finished Goods Minimum Cash Balance Total Current Assets Liabilities Wages Payable Other Accounts Payable Total Current Liabilities Net Working Capital Increase in Net Working Capital Estimated 2005 Balance Sheet Data for Ideko Corporation Balance Sheet ($ 000) Assets Cash and Equivalents 6.164 Accounts Receivable 18,962 Inventories 6,165 Total Current Assets 31,291 Property, Plant, and Equipment 50,040 Goodwill 72,332 Total Assets 153,663 Liabilities and Stockholders' Equity Accounts Payable Debt Total Liabilities Stockholders' Equity Total Liabilities and Equity 4,654 99,000 103.654 50,009 153,663 Print Done