Unit 3 Assignment: Supply and Demand Assignment: In this assignment= you will demonstrate your understanding of the production possibility frontier model, marginal opportunity costs= and
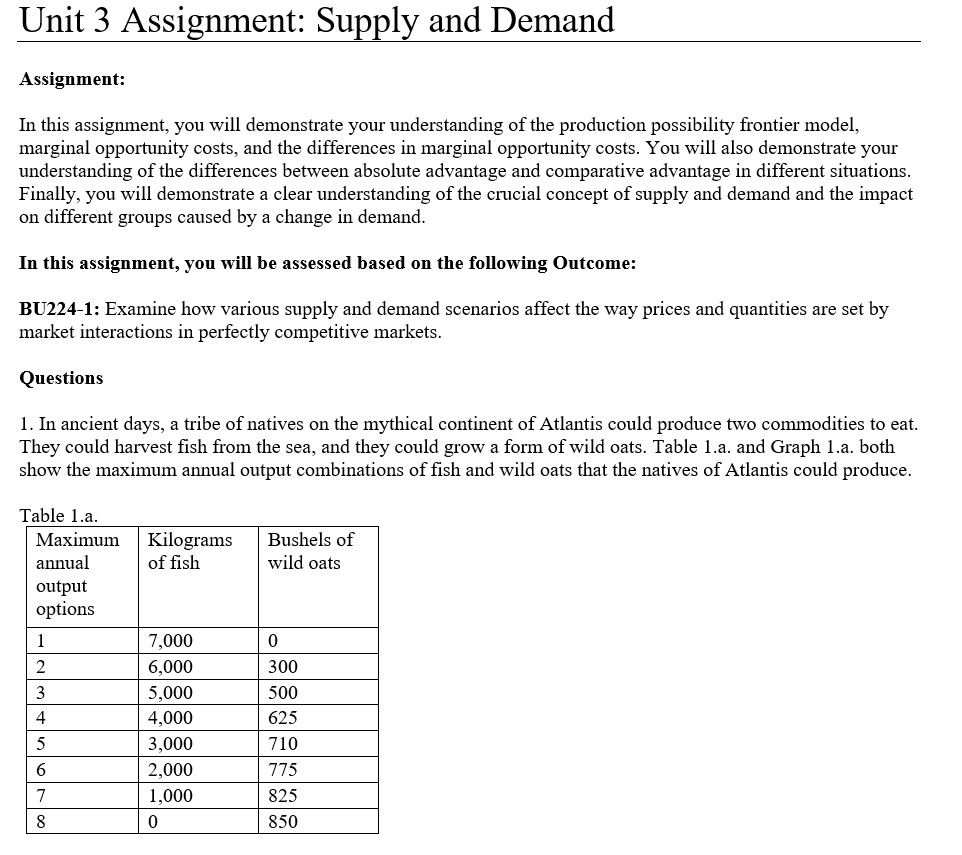
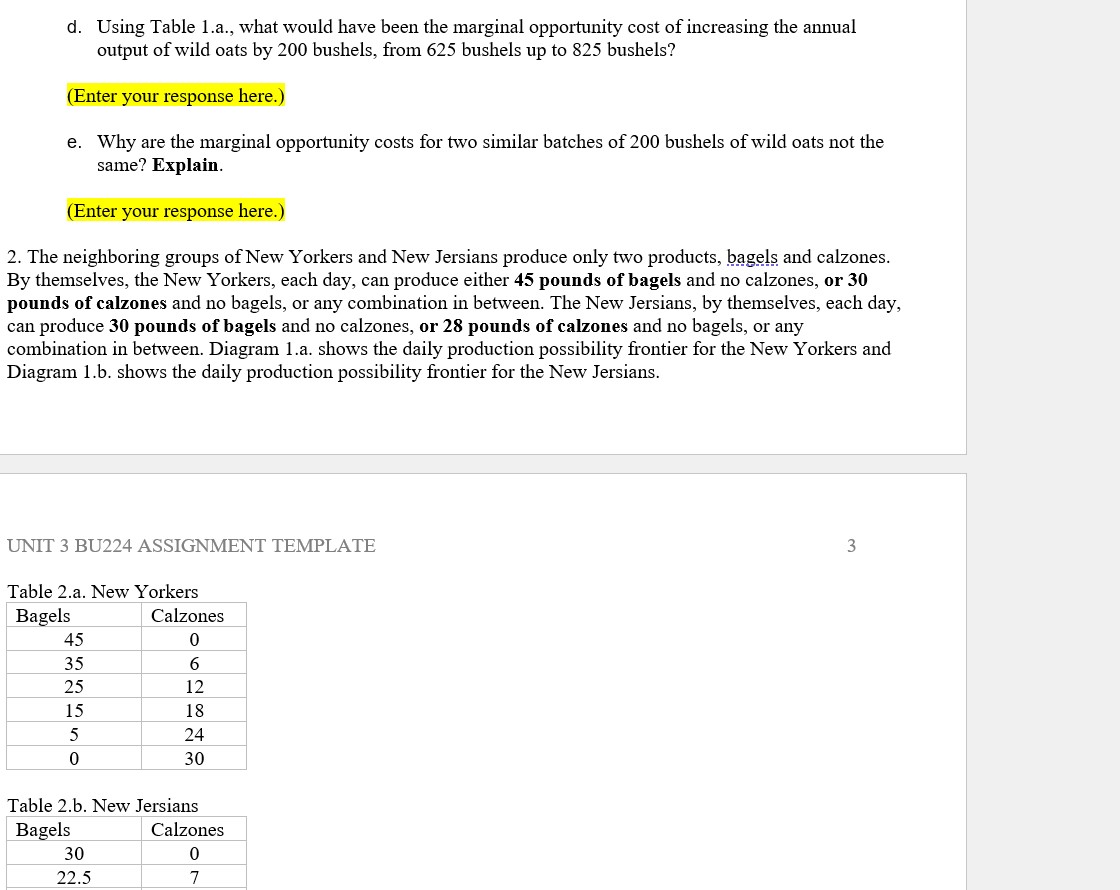
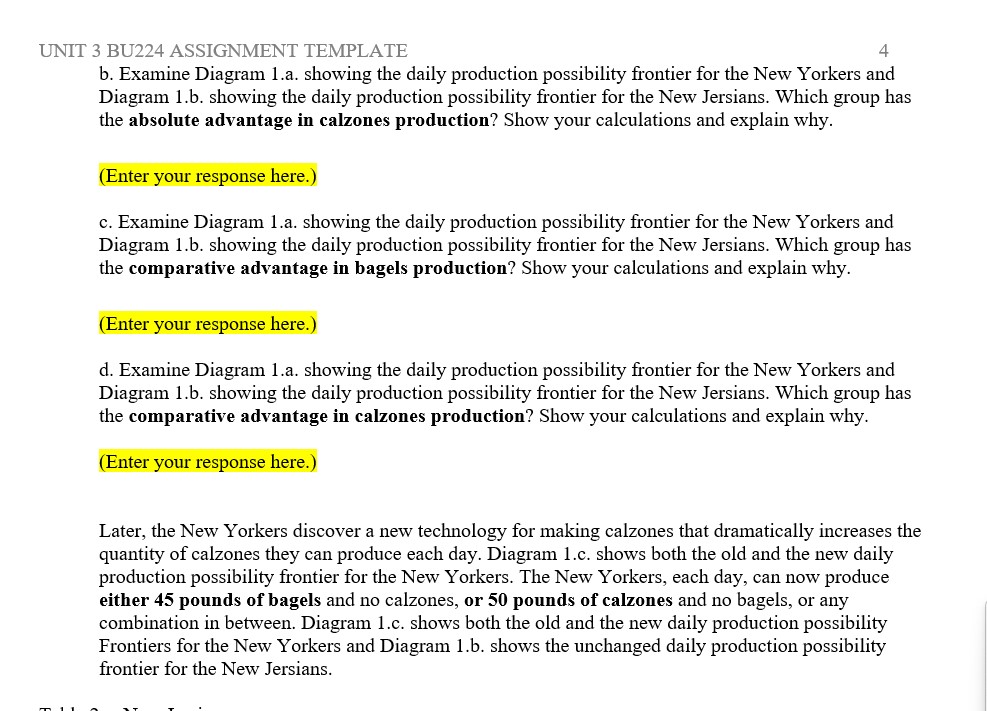
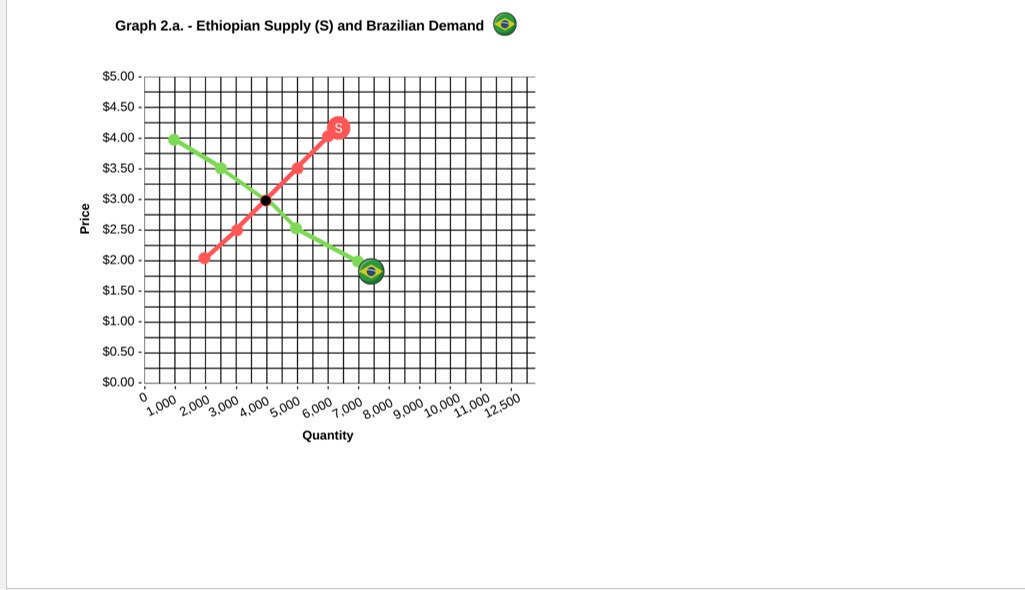
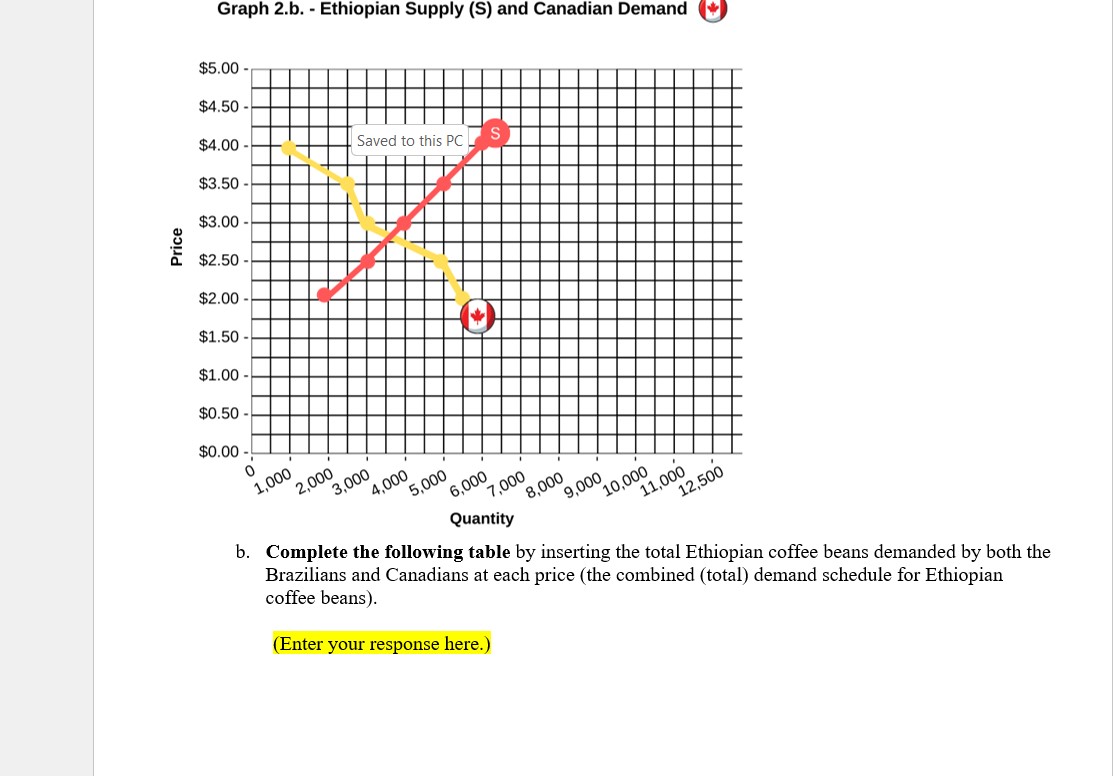
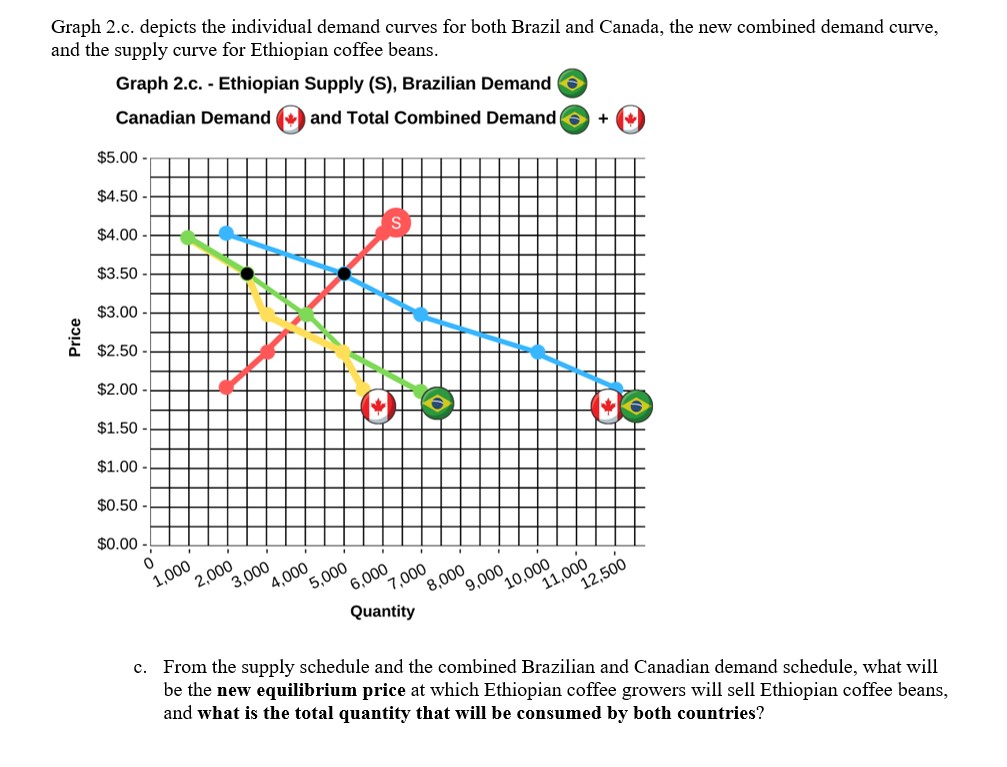
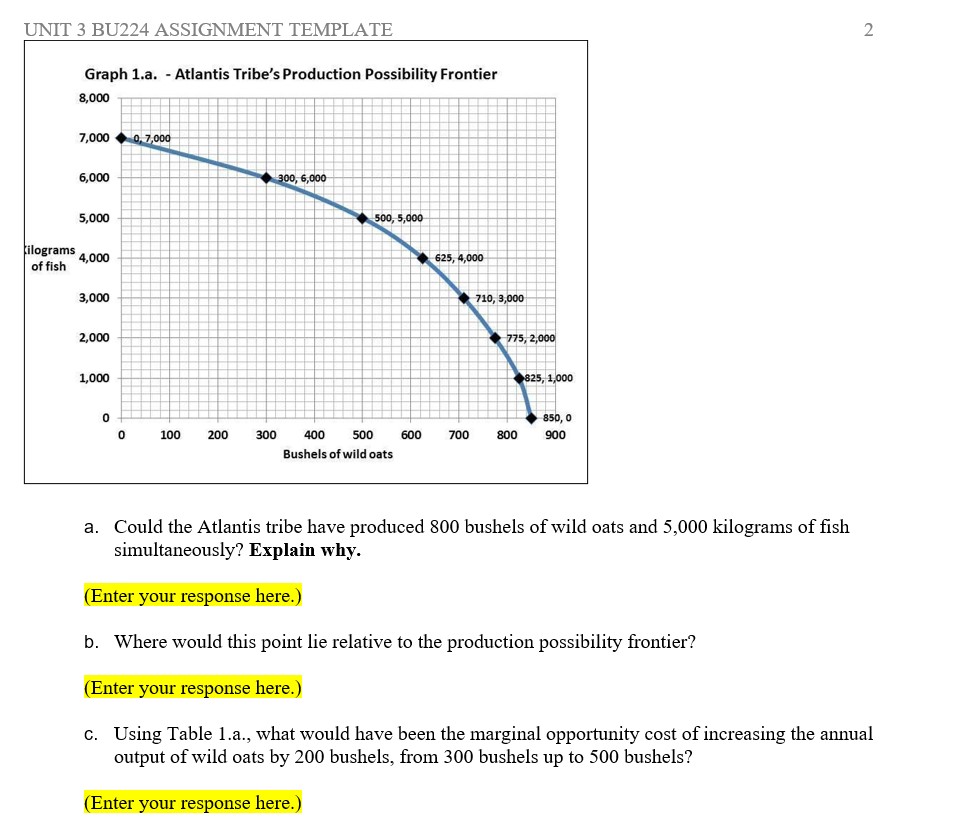
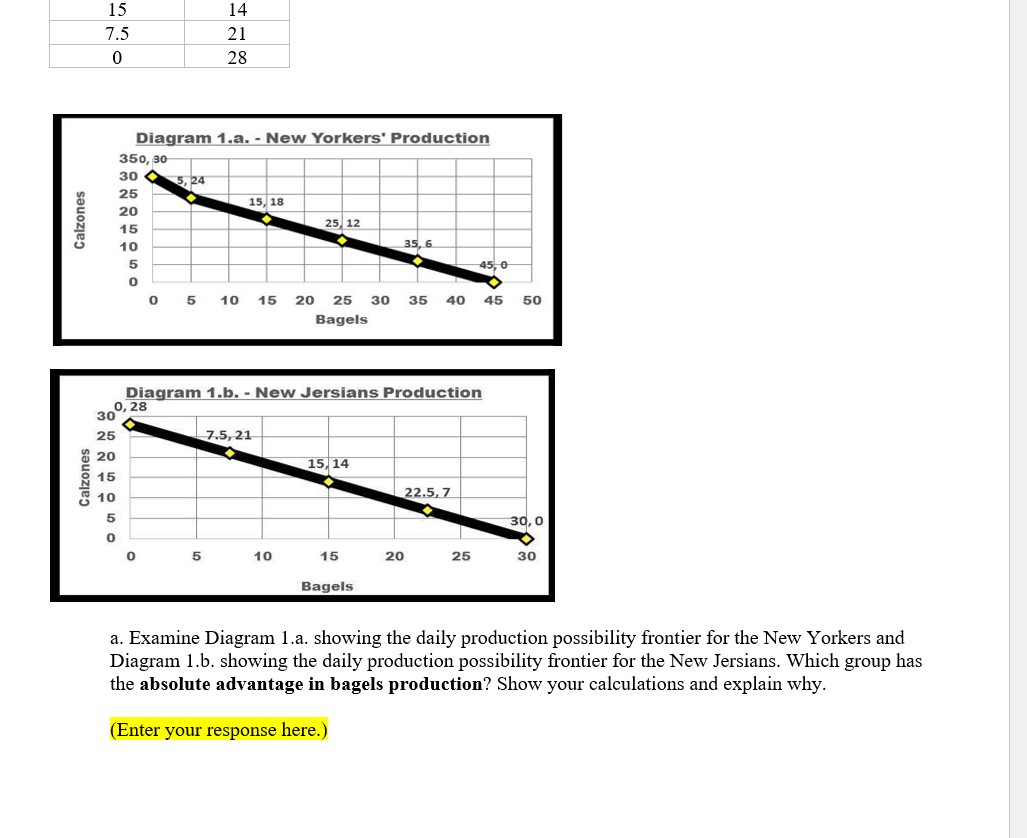
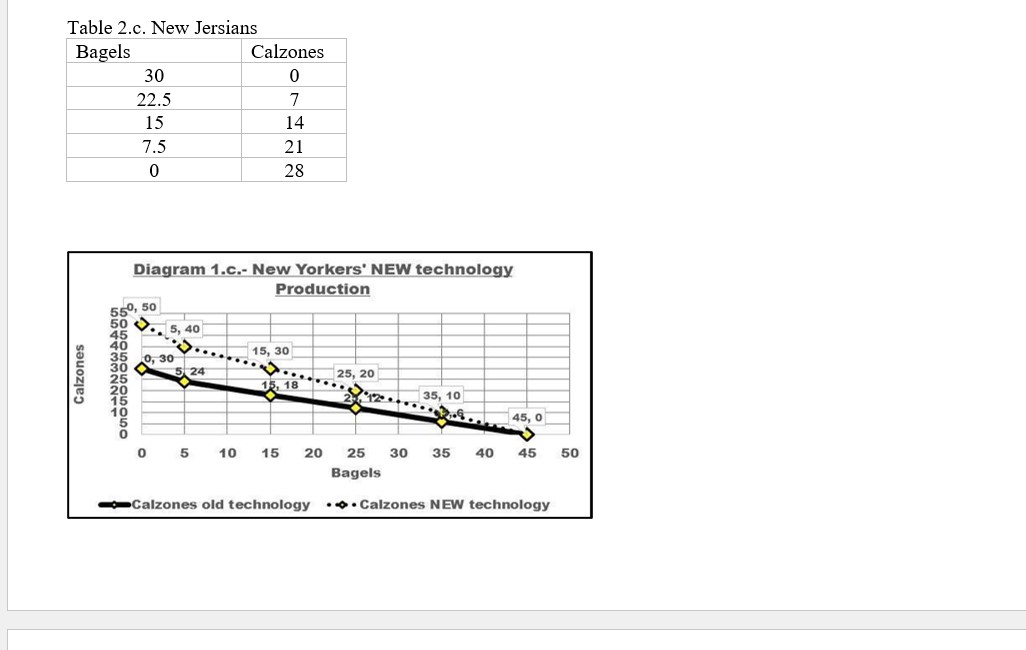
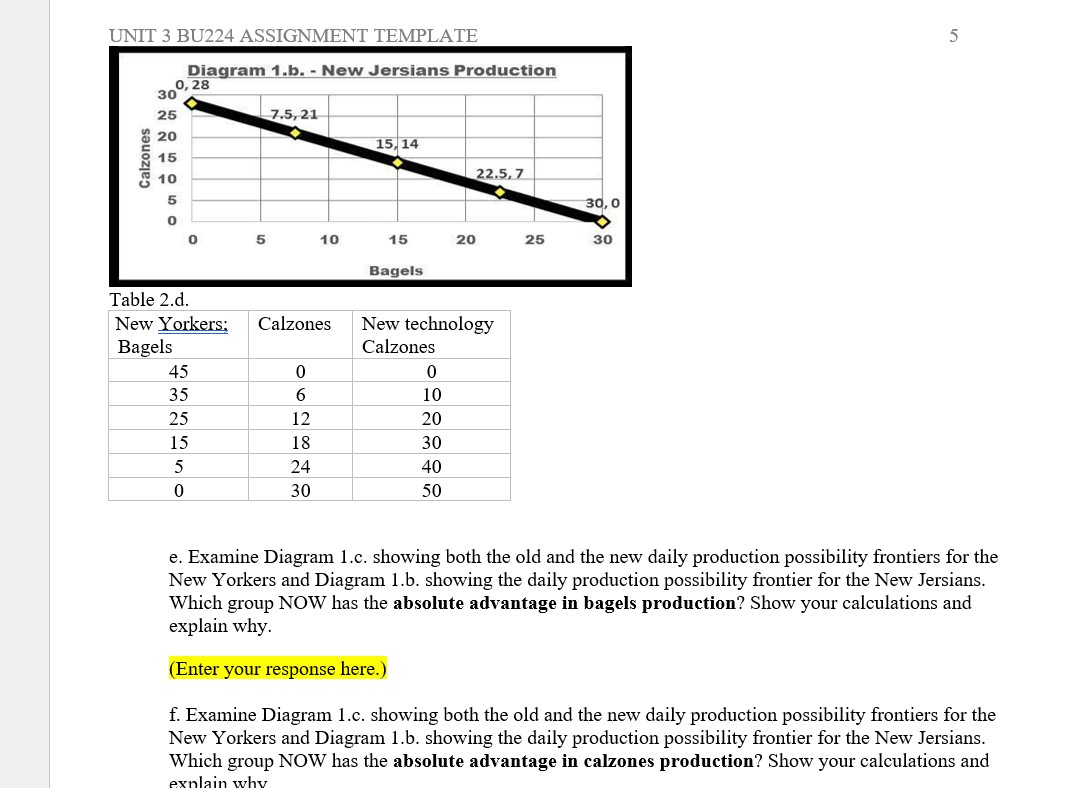
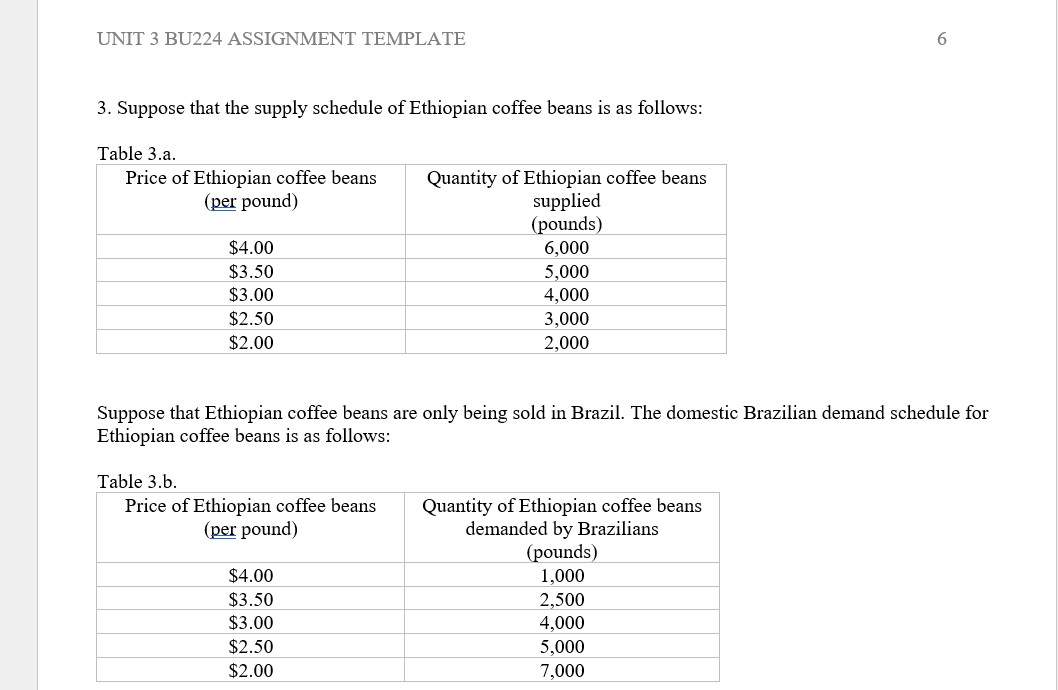
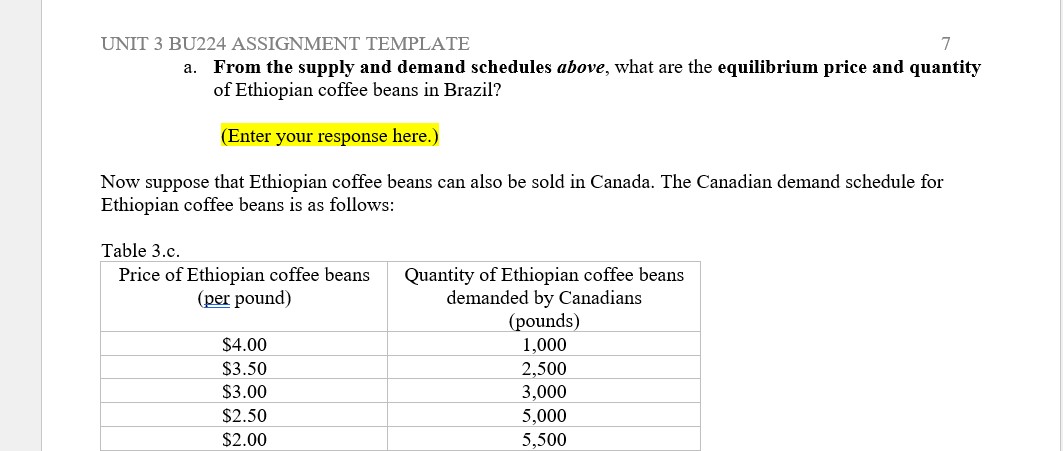
Unit 3 Assignment: Supply and Demand Assignment: In this assignment= you will demonstrate your understanding of the production possibility frontier model, marginal opportunity costs= and the differences in marginal opportunity costs. You will also demonstrate your understanding of the differences between absolute advantage and comparative advantage in different situations. Finally, you will demonstrate a clear understanding of the crucial concept of supply and demand and the impact on different groups caused by a change in demand. In this assignment, you will be assessed based on the following Outcome: BU2241: Examine hovr various supply and demand scenarios affect the way prices and quantities are set by market interactions in perfectly competitive markets. Questions 1. In ancient days, a tribe of natives on the mythical continent of Atlantis could produce two commodities to eat. They could harvest fish from the sea. and they could grow a form of wild oats. Table La. and Graph ].a. both show the maximum annual output combinations of fish and wild oats that the natives of Atlantis could produce. Table ].a. Maximum Kilograms Bushels of annual of fish wild oats UNIT 3 BU224 ASSIGNMENT TEMPLATE 2 Graph 1.a. - Atlantis Tribe's Production Possibility Frontier 8,000 7,000 0, 7,000 6,000 300, 6,000 5,000 500, 5,000 ilograms 4.000 625, 4,000 of fish 3,000 710, 3,000 2,000 775, 2,000 1,000 825, 1,000 850, 0 100 200 300 400 500 600 700 800 900 Bushels of wild oats a. Could the Atlantis tribe have produced 800 bushels of wild oats and 5,000 kilograms of fish simultaneously? Explain why. (Enter your response here.) b. Where would this point lie relative to the production possibility frontier? (Enter your response here.) C. Using Table 1.a., what would have been the marginal opportunity cost of increasing the annual output of wild oats by 200 bushels, from 300 bushels up to 500 bushels? (Enter your response here.)(1. Using Table 1.a.. what would have been the marginal opportunity cost of increasing the annual output ofwild oats by 200 bushels, from 625 bushels up to 825 bushels? (Enter your response here.) 3. Why are the marginal opportunity costs for two similar batches of 200 bushels of wild oats not the same? Explain. (Enter your response here.) 2. The neighboring groups of New Yorkers and New Jersians produce only two products, bagels and calzones. By themselves, the New Yorkers, each day. can produce either 45 pounds of bagels and no calzones, or 30 pounds of calzones and no bagels, or any combination in between. The New Jersians, by themselves, each day, can produce 30 pounds of bagels and no calzones, or 28 pounds of calzones and no bagels, or any combination in between. Diagram 1.a. shows the daily production possibility frontier for the New Yorkers and Diagram 1 .b. shows the daily production possibility frontier for the New Jersians. [KIT 3 B1224 ASSIGNh-'IENT TEMPLATE 3 Table 2.a. New Yorkers Bagels Calzones 45 0 35 6 25 12 15 18 5 24 0 30 Table 2.b. New Jersians Bagels Calzones 30 0 22.5 7 15 14 7.5 21 0 28 Diagram 1.a. - New Yorkers' Production 350, 30 30 4 5, 24 25 20 15, 18 Calzones 15 25 12 10 35, 6 45, 0 0 5 10 15 20 25 30 35 40 45 50 Bagels Diagram 1.b. - New Jersians Production 30 28 25 7.5, 21 20 15, 14 Calzones 15 10 22.5,7 30,0 10 15 20 25 30 Bagels a. Examine Diagram 1.a. showing the daily production possibility frontier for the New Yorkers and Diagram 1.b. showing the daily production possibility frontier for the New Jersians. Which group has the absolute advantage in bagels production? Show your calculations and explain why. (Enter your response here.)UNIT 5 BEBE1 ASSICiNh-'iENT TEik-'IPLATE 4 b. Examine Diagram 1,a. showing the daily production possibility frontier for the New Yorkers and Diagram Lb. showing the daily production possibility frontier for the New Jersians. 'Which group has the absolute advantage in calzones production? Show your calculations and explain why. (Enter your response here.) c. Examine Diagram l.a. showing the daily production possibility frontier for the New Yorkers and Diagram Lb. showing the daily production possibility frontier for the New Jersians. Which group has the comparative advantage in bagels production? Show your calculations and explain why. (Enter your response here.) d. Examine Diagram 1.a. showing the daily production possibility frontier for the New Yorkers and Diagram Lb. showing the daily production possibility frontier for the New Jersians. 'Which group has the comparative advantage in calzones production? Show your calculations and explain why. (Enter your response here.) Later, the New Yorkers discover a new technology for making calzones that dramatically increases the quantity of calzones they can produce each day. Diagram 1.c. shows both the old and the new daily production possibility frontier for the New Yorkers. The New Yorkers, each day, can now produce either 45 pounds of bagels and no calzones, or 50 pounds of calzones and no bagels, or any combination in between. Diagram 1.c. shows both the old and the new daily production possibility Frontiers for the New Yorkers and Diagram 1b. shows the unchanged daily production possibility frontier for the New Jersians. \fUNIT 3 BU224 ASSIGNMENT TEMPLATE VI Diagram 1.b. - New Jersians Production 0, 28 25 7.5, 21 20 15, 14 Calzones 15 10 22.5, 7 30, 0 0 5 10 15 20 25 30 Bagels Table 2.d. New Yorkers; Calzones New technology Bagels Calzones 45 0 0 35 6 10 25 12 20 15 18 30 5 24 40 0 30 50 e. Examine Diagram 1.c. showing both the old and the new daily production possibility frontiers for the New Yorkers and Diagram 1.b. showing the daily production possibility frontier for the New Jersians. Which group NOW has the absolute advantage in bagels production? Show your calculations and explain why. (Enter your response here.) f. Examine Diagram 1.c. showing both the old and the new daily production possibility frontiers for the New Yorkers and Diagram 1.b. showing the daily production possibility frontier for the New Jersians. Which group NOW has the absolute advantage in calzones production? Show your calculations and(Enter your response here.) f. Examine Diagram l.c. showing both the old and the new daily production possibility frontiers for the New Yorkers and Diagram Lb. showing the daily production possibility frontier for the New Jersians. Which group NOW has the absolute advantage in calzones production? Show your calculations and explain why. (Enter your response here.) g. Examine Diagram 1.c. showing both the old and the new daily production possibility frontiers for the New Yorkers and Diagram Lb. showing the daily production possibility frontier for the New Jersians. Which group NOW has the comparative advantage in bagels production? Show your calculations and explain why this is important. (Enter your response here.) h. Examine diagram 1.c. showing both the old and the new daily production possibility frontiers for the New Yorkers and diagram 1.b. showing the daily production possibility frontier for the New Jersians. Which group NOW has the comparative advantage in calzones production? Show your calculations and explain why this is important. (Enter your response here.) UNIT 3 BU224 ASSIGNMENT TEMPLATE 6 3. Suppose that the supply schedule of Ethiopian coffee beans is as follows: Table 3.a. Price of Ethiopian coffee beans Quantity of Ethiopian coffee beans (per pound) supplied (pounds) $4.00 6,000 $3.50 5,000 $3.00 4,000 $2.50 3,000 $2.00 2,000 Suppose that Ethiopian coffee beans are only being sold in Brazil. The domestic Brazilian demand schedule for Ethiopian coffee beans is as follows: Table 3.b. Price of Ethiopian coffee beans Quantity of Ethiopian coffee beans (per pound) demanded by Brazilians (pounds) $4.00 1,000 $3.50 2,500 $3.00 4,000 $2.50 5,000 $2.00 7,000Graph 2.a. - Ethiopian Supply (S) and Brazilian Demand $5.00 $4.50 $4.00 $3.50 S $3.00 Price $2.50 $2.00 $1.50 $1.00 $0.50 $0.00 0 1,000 2,000 3,000 4,000 5,000 6,000 7,000 8,000 9,000 10,000 11,000 Quantity 12,500UNIT 3 BU224 ASSIGNMENT TEMPLATE 7 a. From the supply and demand schedules above, what are the equilibrium price and quantity of Ethiopian coffee beans in Brazil? (Enter your response here.) Now suppose that Ethiopian coffee beans can also be sold in Canada. The Canadian demand schedule for Ethiopian coffee beans is as follows: Table 3.c. Price of Ethiopian coffee beans Quantity of Ethiopian coffee beans (per pound) demanded by Canadians (pounds) $4.00 1,000 $3.50 2,500 $3.00 3,000 $2.50 5,000 $2.00 5,500Graph 2.b. - Ethiopian Supply (S) and Canadian Demand *) $5.00 $4.50 $4.00 Saved to this PC S $3.50 $3.00 Price $2.50 $2.00 $1.50 $1.00 $0.50 $0.00 - 0 1,000 2,000 3,000 4,000 5,000 6,000 7,000 8,000 9,000 10,000 11,000 12,500 Quantity b. Complete the following table by inserting the total Ethiopian coffee beans demanded by both the Brazilians and Canadians at each price (the combined (total) demand schedule for Ethiopian coffee beans). (Enter your response here.)Graph 2.c. depicts the individual demand curves for both Brazil and Canada, the new combined demand curve, and the supply curve for Ethiopian coffee beans. Graph 2.c. - Ethiopian Supply (S), Brazilian Demand Canadian Demand (*) and Total Combined Demand + $5.00 - $4.50 $4.00 S $3.50 $3.00 Price $2.50 $2.00 $1.50 $1.00 $0.50 $0.00 - 0 1,000 2,000 3,000 4,000 5,000 6,000 7,000 8,000 9,000 10,000 11,000 12,500 Quantity c. From the supply schedule and the combined Brazilian and Canadian demand schedule, what will be the new equilibrium price at which Ethiopian coffee growers will sell Ethiopian coffee beans, and what is the total quantity that will be consumed by both countries?Quantity c. From the supply schedule and the combined Brazilian and Canadian demand schedule, what will be the new equilibrium price at which Ethiopian coffee growers will sell Ethiopian coffee beans, and what is the total quantity that will be consumed by both countries? UNIT 3 BU224 ASSIGNMENT TEMPLATE 9 (Enter your response here.) d. With the Ethiopian coffee growers selling to both the Canadians and the Brazilians, what will be the new equilibrium price paid and quantity demanded by Brazilian consumers? (Enter your response here.) e. With the Ethiopian coffee growers selling to both the Canadians and the Brazilians, what will be the new equilibrium price paid and quantity demanded by Canadian consumers? (Enter your response here.)
Step by Step Solution
There are 3 Steps involved in it
Step: 1
Get Instant Access to Expert-Tailored Solutions
See step-by-step solutions with expert insights and AI powered tools for academic success
Step: 2
Step: 3
Ace Your Homework with AI
Get the answers you need in no time with our AI-driven, step-by-step assistance