Question: Unit 7, homework 8 positive, negative, or near 0 ? Describe the overall pattern ? whats the correlation? which is the explanatory variable ? Correlation
Unit 7, homework 8
- positive, negative, or near 0 ?
- Describe the overall pattern ?
- whats the correlation?
- which is the explanatory variable ?
- Correlation between men n women ?
- How would the correlation between body mass and metabolic rate change ?
- Guess the correlation ?
- corr between the variables ?
- whats the correlation? What's the percentage?
- Whats useful about the regression line being 0?
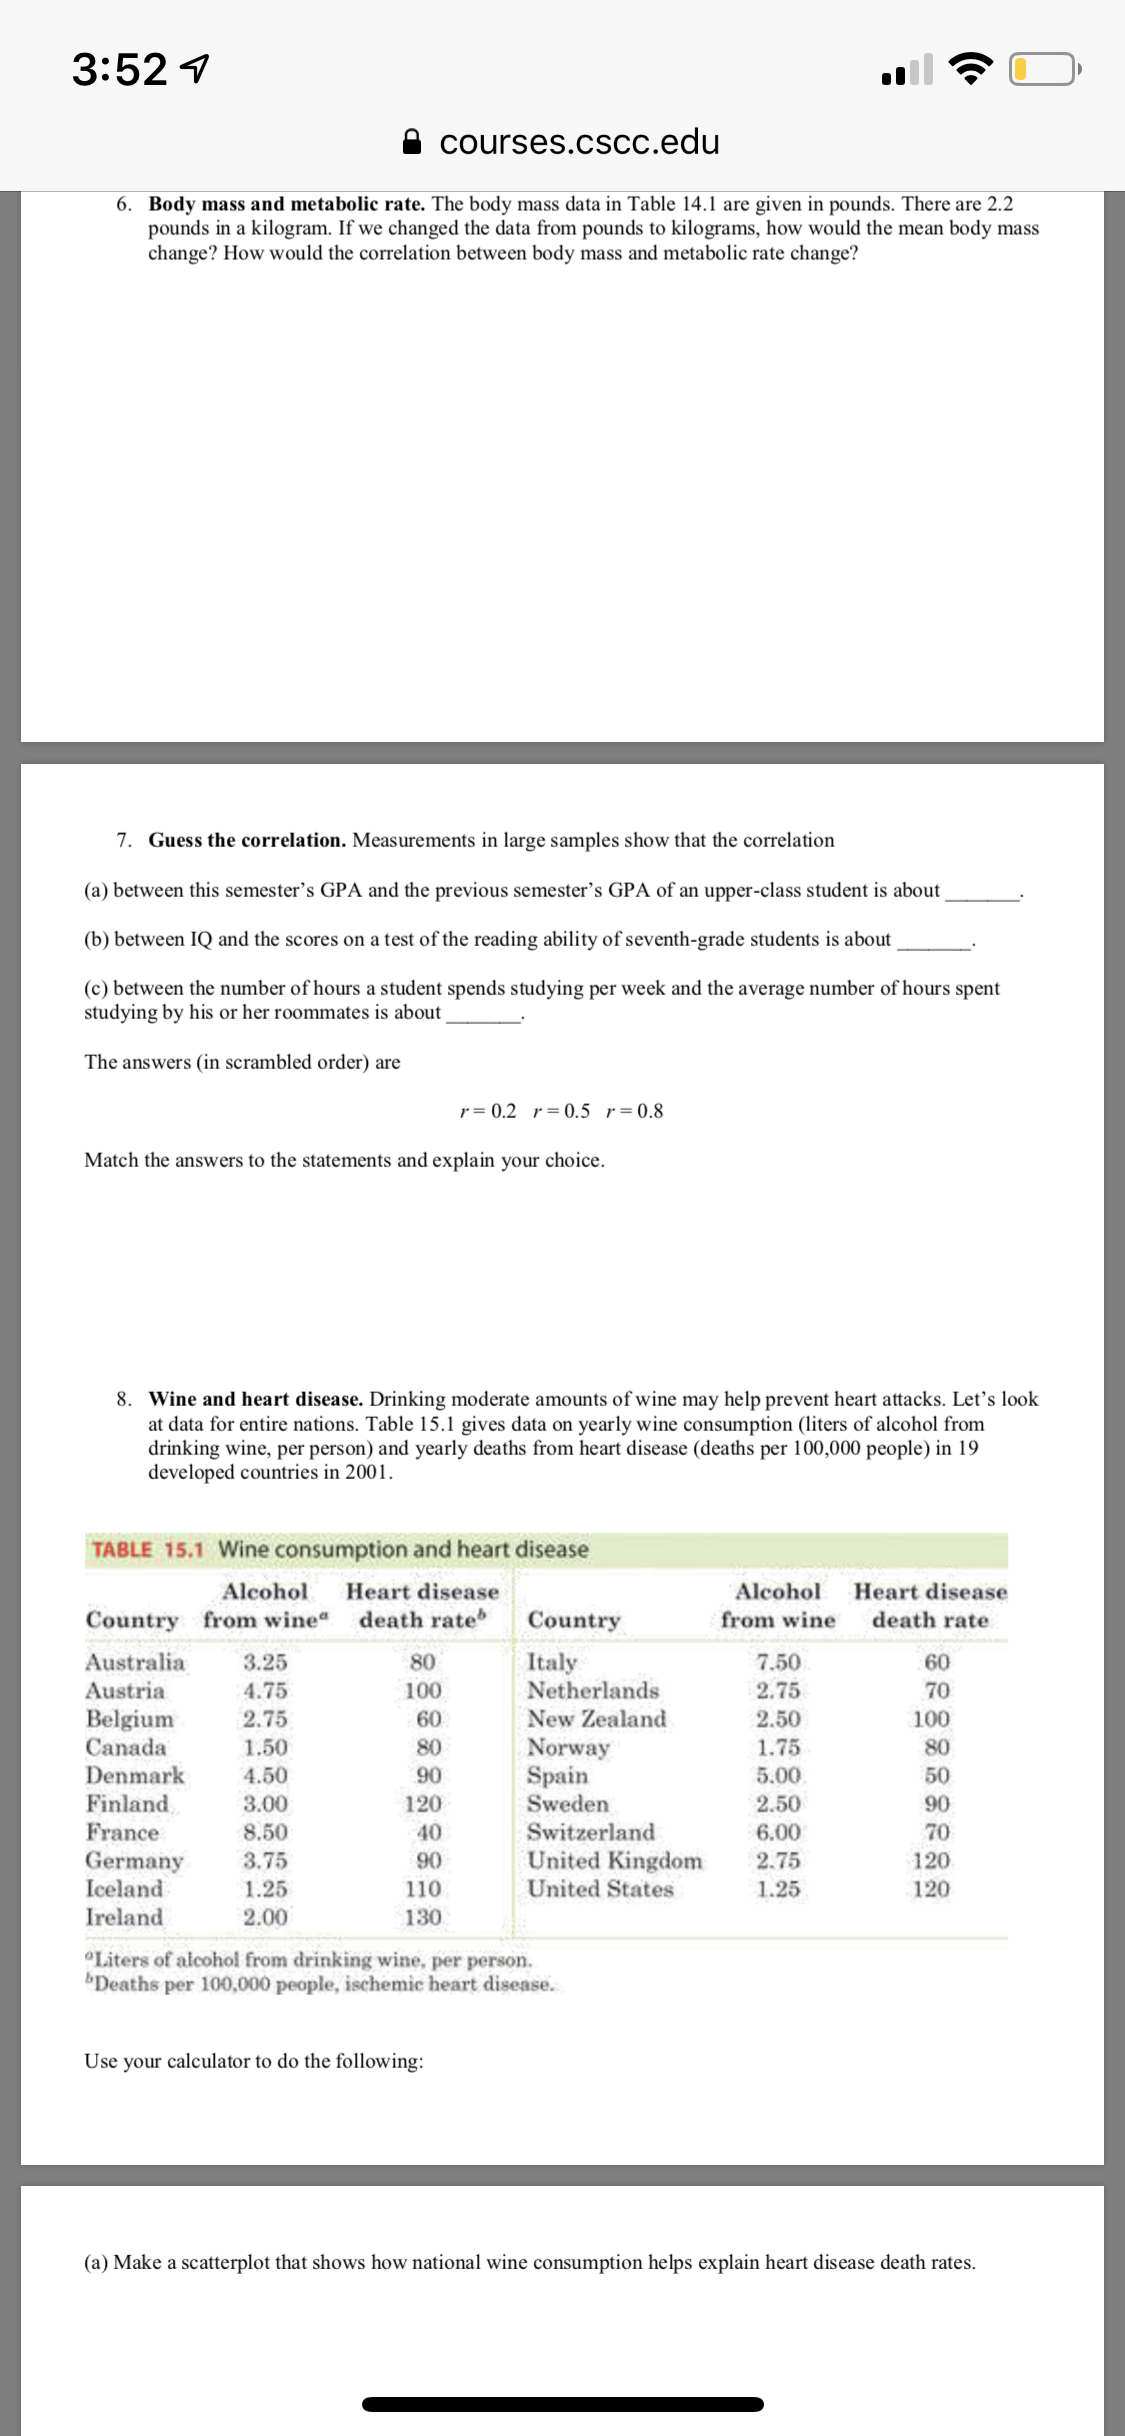
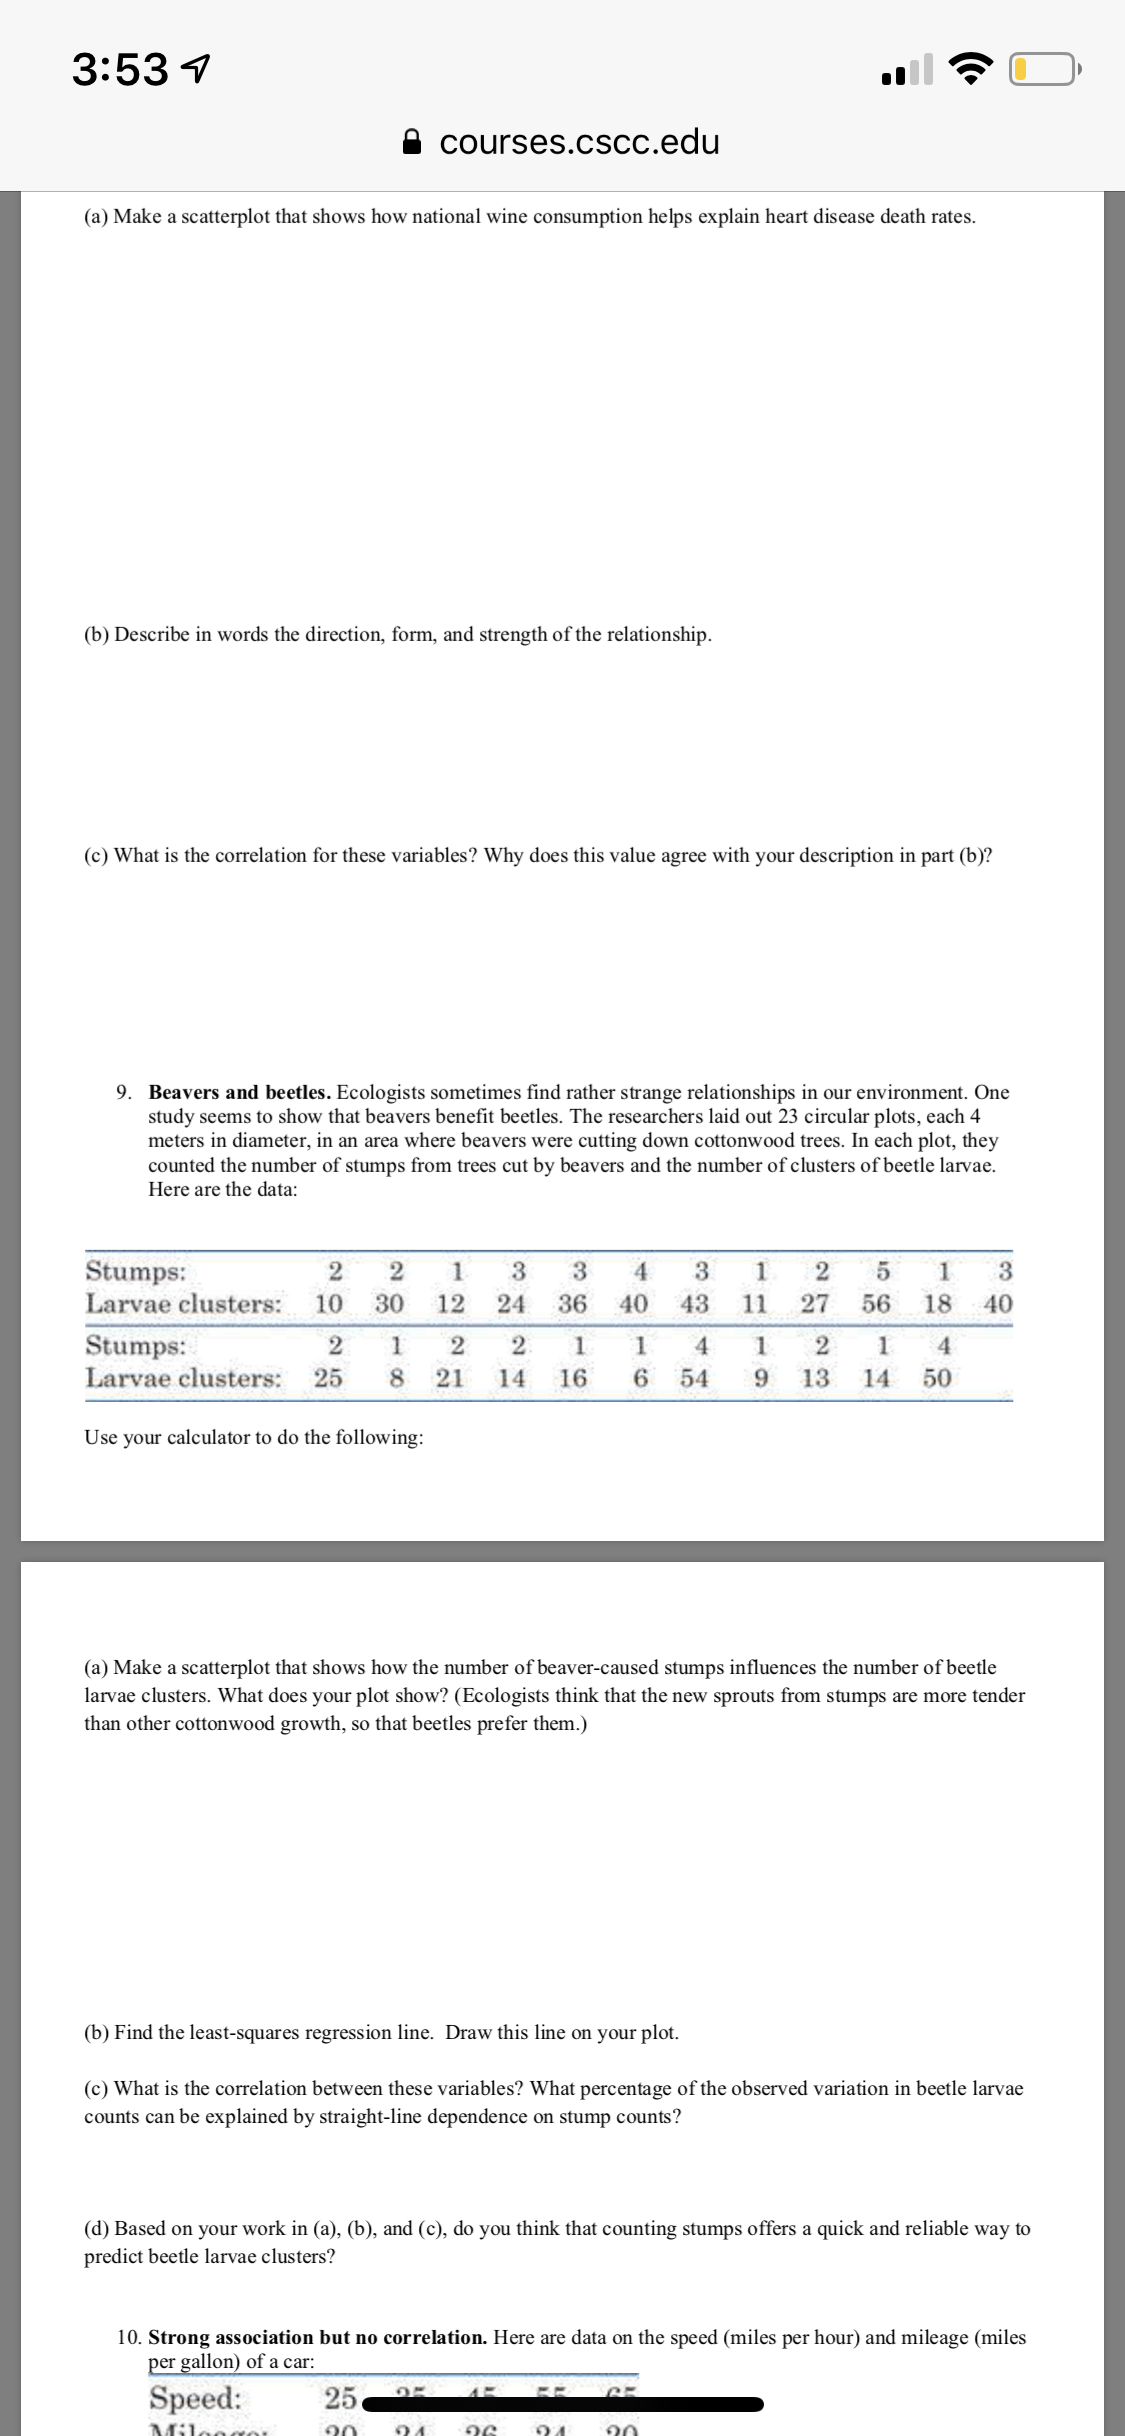
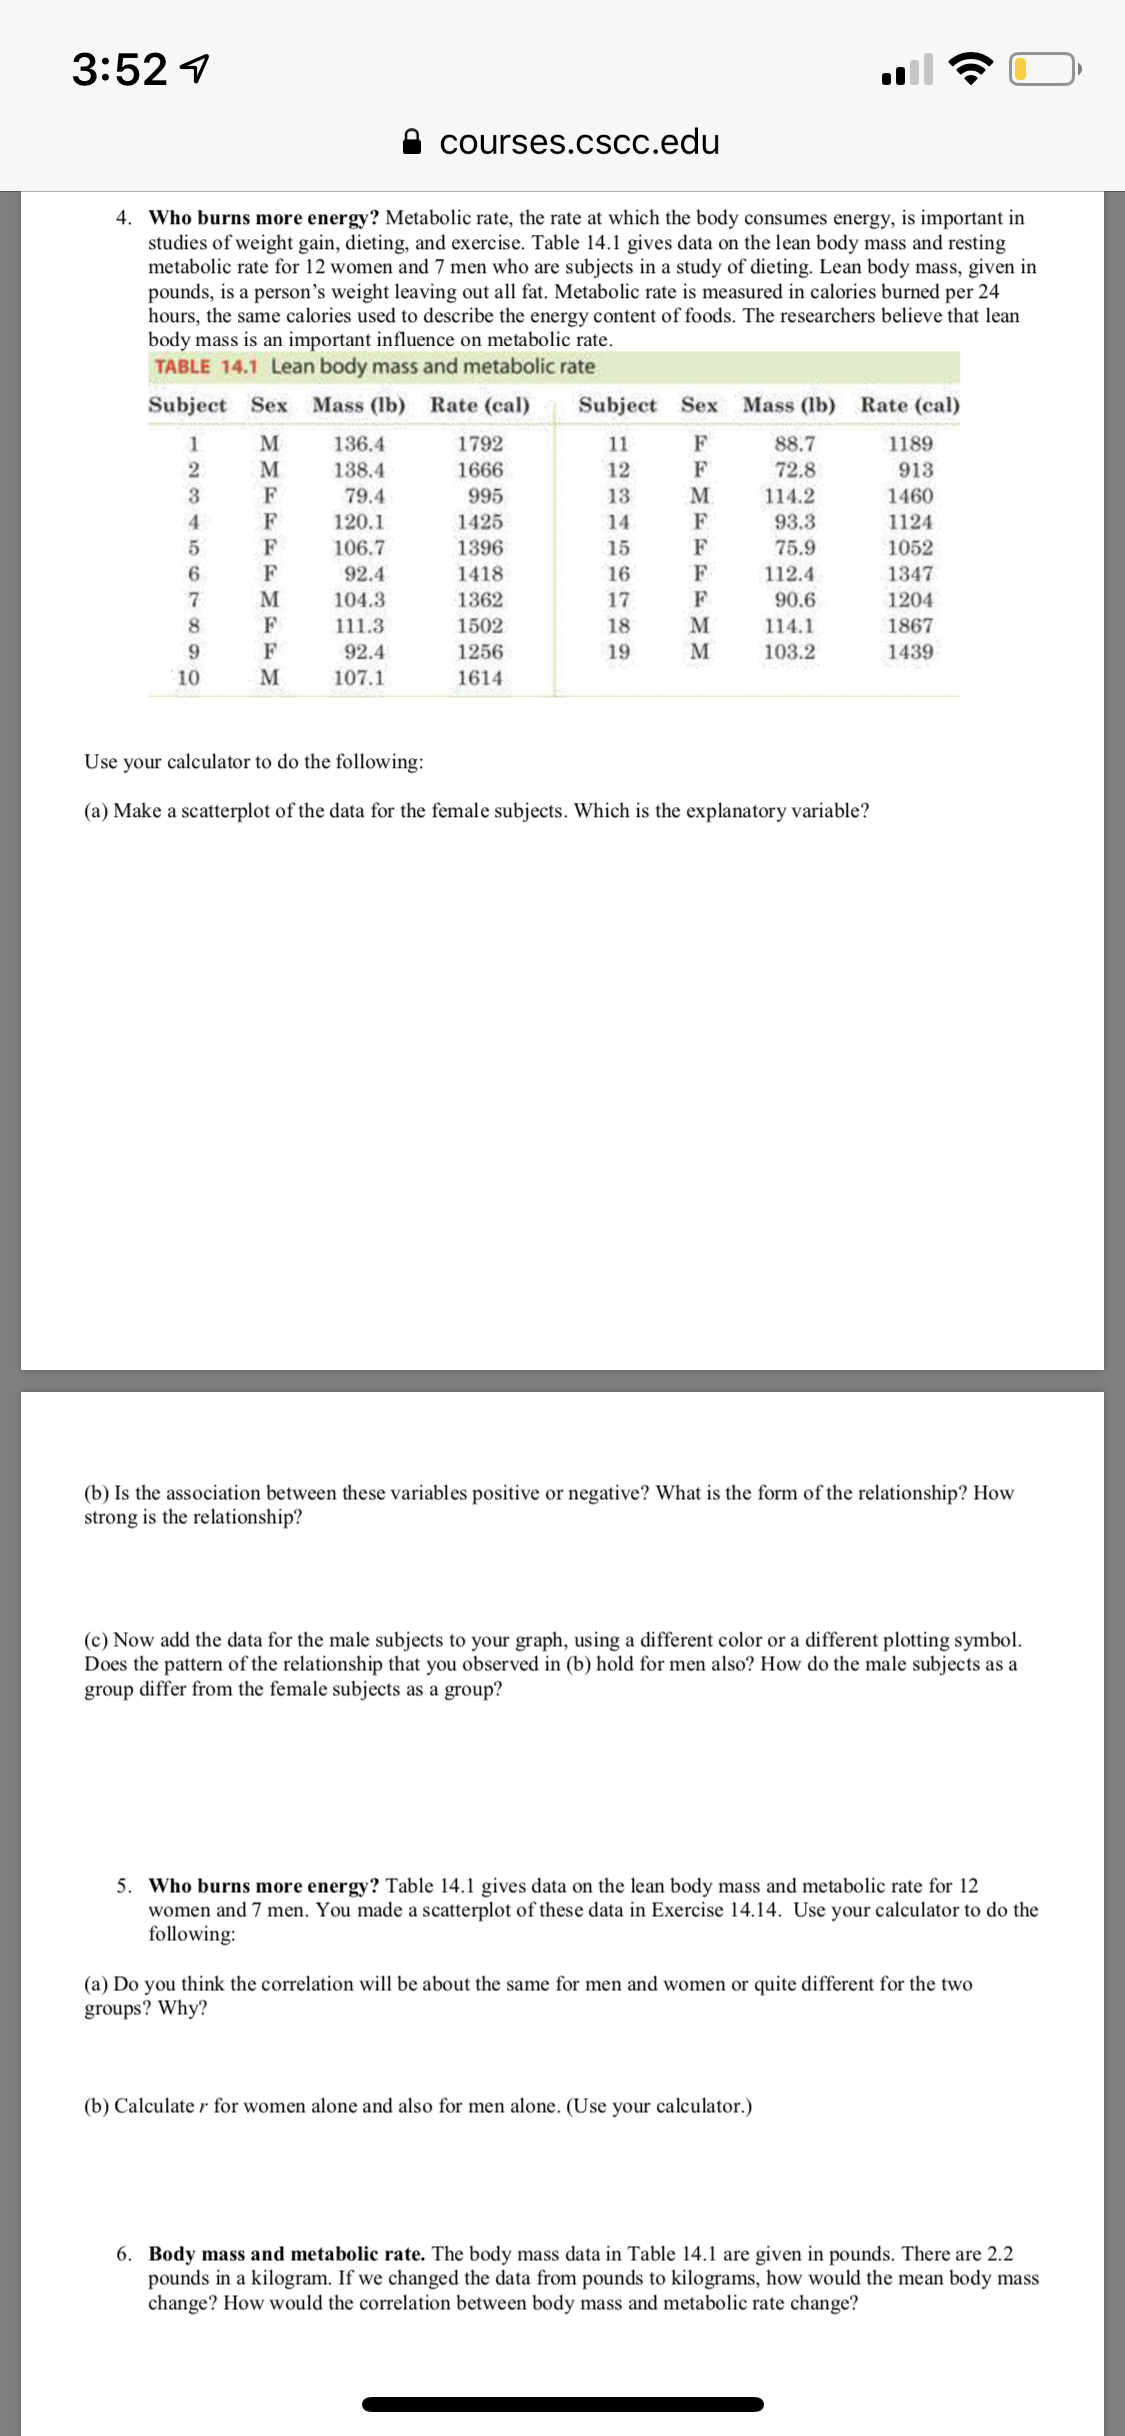
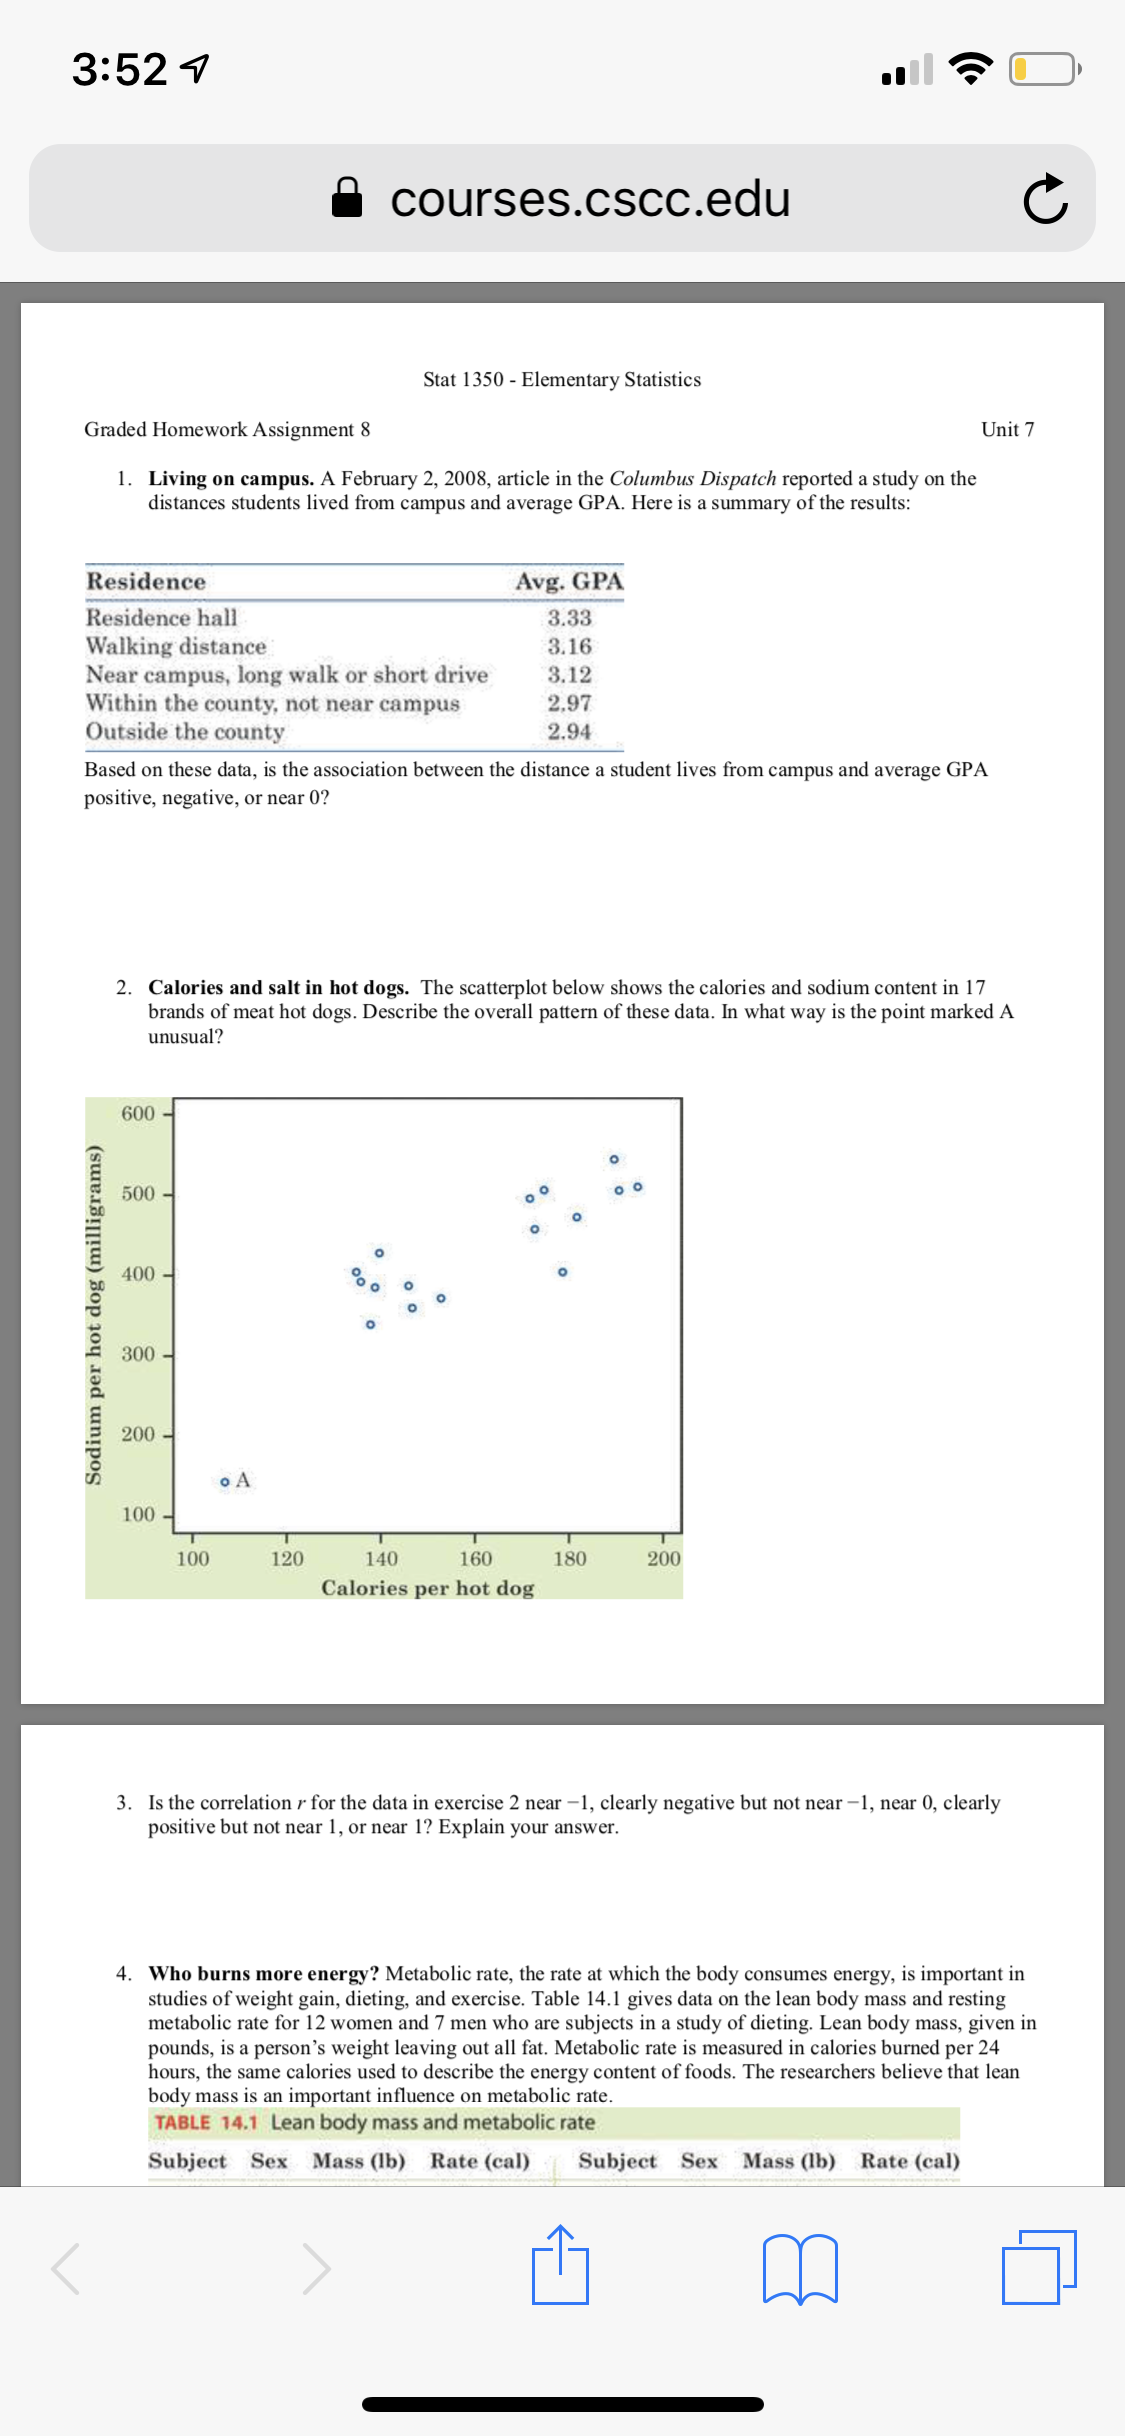
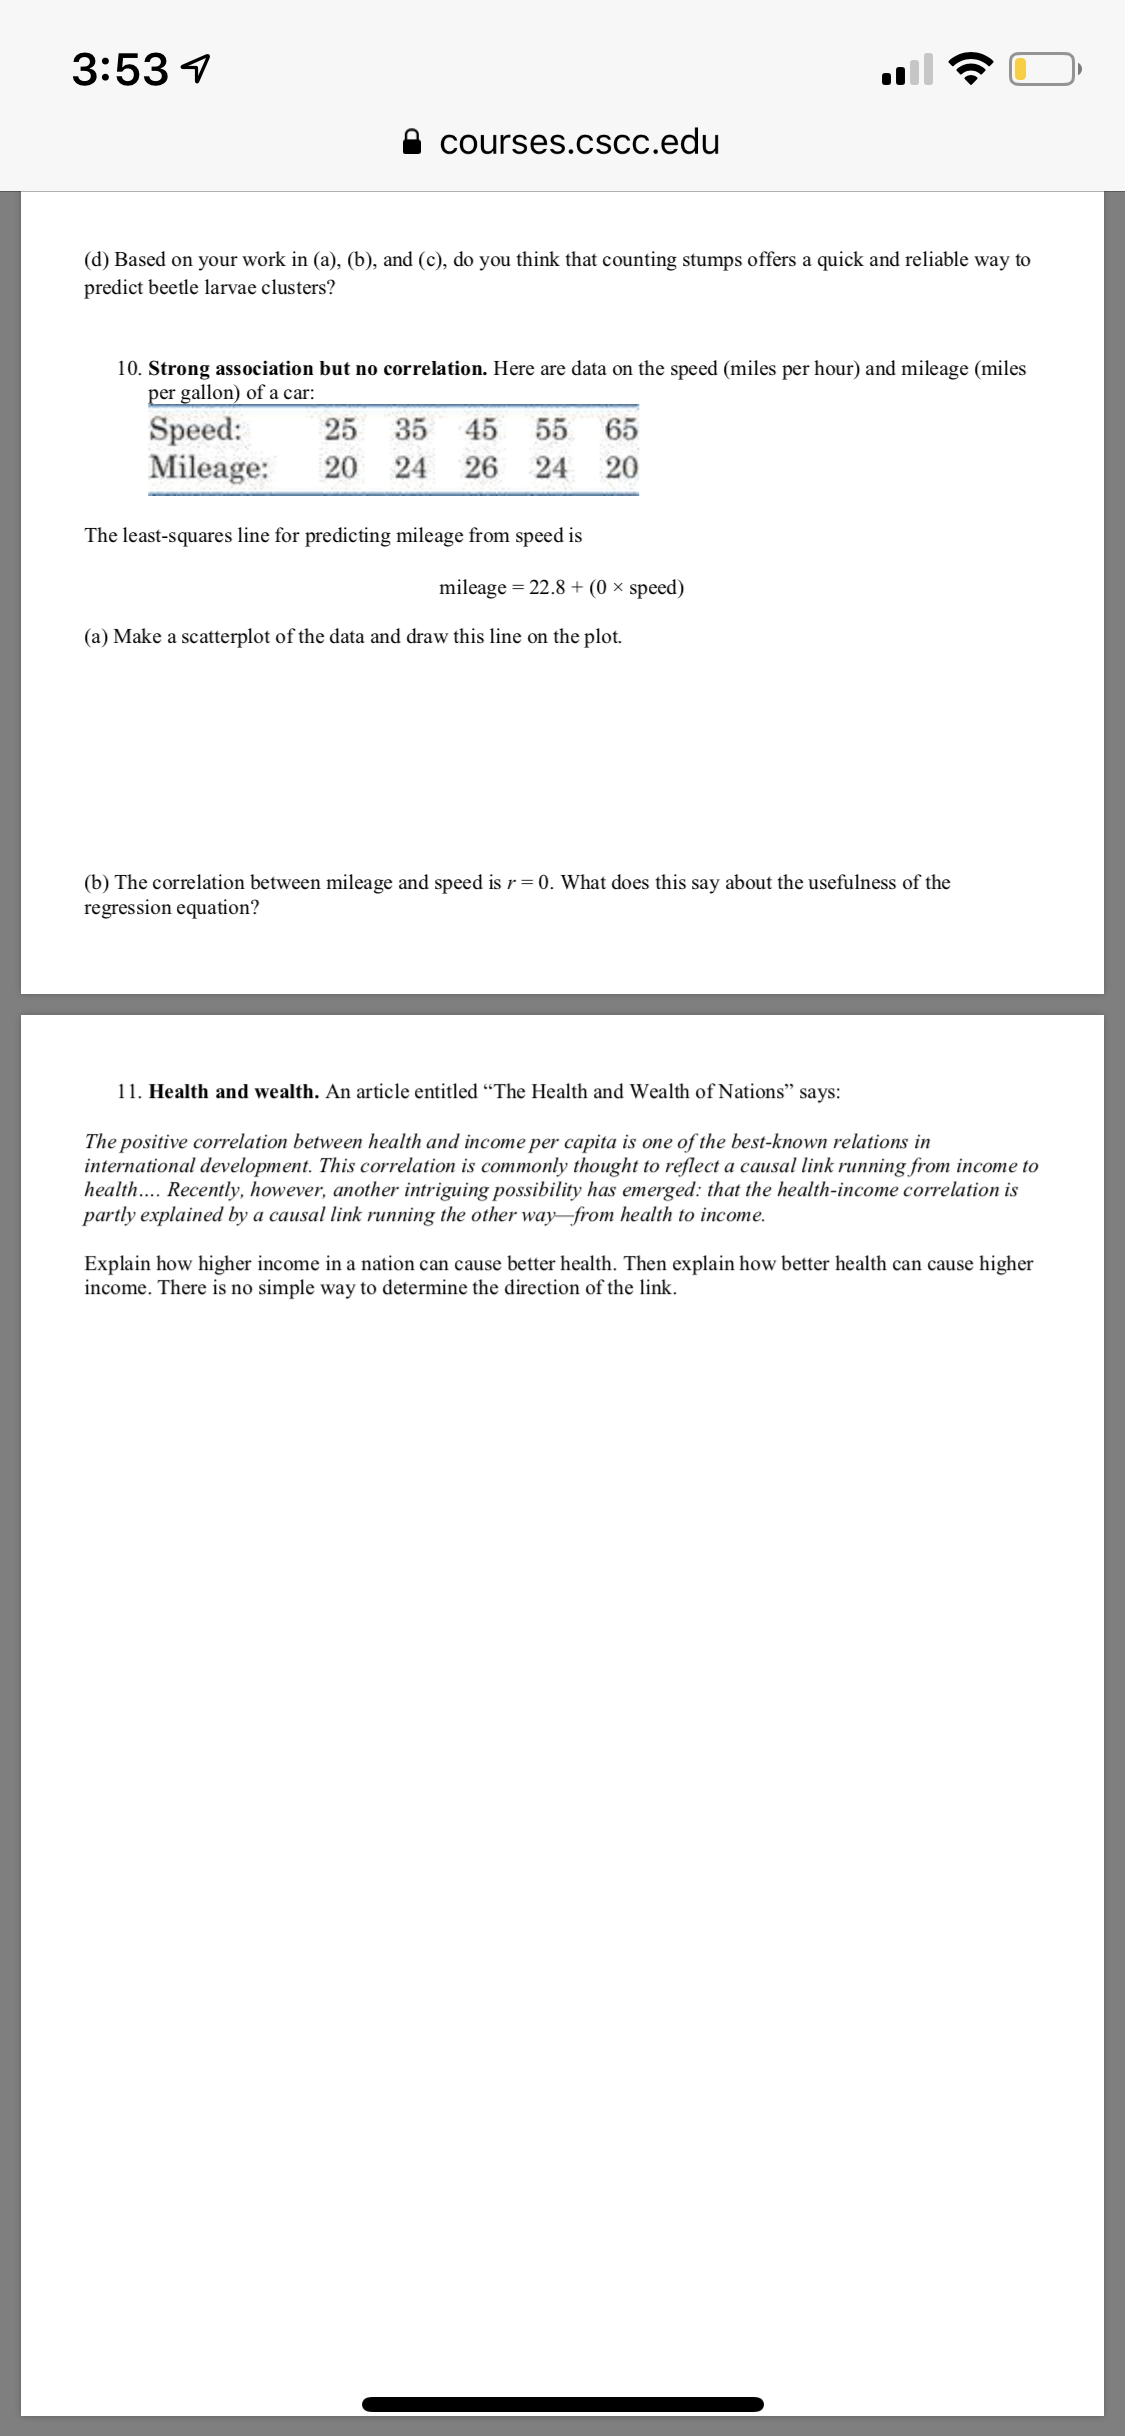
3: 52 9 A courses . cscc . edu 6 . Body mass and metabolic rate . The body mass data in Table 14 . 1 are given in pounds . There are 2 . 2 pounds in a kilogram . If we changed the data from pounds to kilograms , how would the mean body mass change ? How would the correlation between body mass and metabolic rate change ?" 7 . Guess the correlation . Measurements in large samples show that the correlation* ( a ) between this semester's GPA and the previous semester's GPA of an upper-class student is about* ( b ) between 10 and the scores on a test of the reading ability of seventh-grade students is about* ( C ) between the number of hours a student spends studying per week and the average number of hours spent* studying by his or her roommates is about* The answers ( in scrambled order ) are* * = 0.2 7 = 0.5 7 = 0.8 Match the answers to the statements and explain your choice . 8 . Wine and heart disease . Drinking moderate amounts of wine may help prevent heart attacks . Let's look at data for entire nations . Table 15 . 1 gives data on yearly wine consumption ( liters of alcohol from drinking wine , per person ) and yearly deaths from heart disease ( deaths per 100 , 000 people ) in 19 developed countries in 2001 .* TABLE 15 . 7 Wine consumption and heart disease Alcohol Heart disease Alcohol Heart disease* Country\\ from wines* death rate!* Country from wine* death rate* Australia 3.25 80 Italy 7.50 09 Austria 4.75 100 Netherlands 2.75 OL Belgium 2.75 60 New Zealand 2.50 100 Canada 1. 50 80 Norway 1.75 80 Denmark 4.50 90 Spain 5.00 50 Finland 3.00 120 Sweden 2.50 90 France 8.50 40 Switzerland 6.00 70 Germany" 3.75 90 United Kingdom 2.75 120 Iceland 1.25 110 United States* 1.25 120 Ireland 2.00 130 " Liters of alcohol from drinking wine , per person . ` Deaths per 100, 000 people , ischemic heart disease . Use your calculator to do the following :" ( a) Make a scatterplot that shows how national wine consumption helps explain heart disease death rates*3153 4 all '5' C} B courses.cscc.edu (a) Mre a scatterplot that shows how national wine consumption helps explain heart disease death rates. (b) Describe in words the direction, form, and strength of the relationship. (c) What is the correlation for these variables? Why does this value agree with your description in part (b)? 9. Beavers and beetles. Ecologists sometimes nd rather strange relationships in our environment. One study seems to show that beavers benet beetles. The researchers laid out 23 circular plots, each 4 meters in diameter, in an area where beavers were cutting down cottonwood trees. In each plot, they counted the number of stumps from trees cut by beavers and the number of clusters of beetle larvae. Herearethedata: Stumps: 221334312513 Larvaecluabers: 10 30 12 24 36 40 43 11 27 56 18 40 Stumps: 2 1 2 2 1 l 4 1 2 1 4 Larvaeclusters: 25 8 21 14 16 6 54 9 13 I4 50 Use your calculator to do the following: (a) Make a scatterplot that shows how the number of beavercaused stumps inuences the number of beetle larvae clusters. What does your plot show? (Ecologists think that the new sprouts from slumps are more tender than other cottonwood growth, so that beetles prefer them.) (b) Find the least-squares regression line. Draw this line on your plot. (c) What is the correlation between these variables? What percentage of the observed variation in beetle larvae counts canbe explained by straightline dependence on stump counts? (d) Based on your work in (a), (b), and (e), do you think that counting stumps offers a quick and reliable way to predict beetle larvae clusters? 10. Strong association but no correlation. Here are data on the speed (miles per hour) and mileage (miles per gallon) of a car: Speed'. 25 % an n A an n A on 15:1,.-~-. 3:52 1 a courses.cscc.edu 4. Who burns more energy? Metabolic rate, the rate at which the body consumes energy, is important in studies of weight gain, dieting, and exercise. Table 14.1 gives data on the lean body mass and resting metabolic rate for 12 women and 7 men who are subjects in a study of dieting. Lean body mass, given in pounds, is a person's weight leaving out all fat. Metabolic rate is measured in calories burned per 24 hours, the same calories used to describe the energy content of foods. The researchers believe that lean body mass is an important influence on metabolic rate. TABLE 14.1 Lean body mass and metabolic rate Subject Sex Mass (lb) Rate (cal) Subject Sex Mass (1b) Rate (cal) M 136.4 1792 11 88.7 1189 M 138.4 1666 12 F 72.8 913 F 79.4 995 13 M 114.2 1460 120.1 1425 14 F. 93.3 1124 106.7 1396 15 F 75.9 1052 92.4 1418 16 F 112.4 1347 104.3 1362 17 F 90.6 111.3 1502 18 M 1204 M 114.1 1867 92.4 1256 19 103.2 1439 107.1 1614 Use your calculator to do the following: (a) Make a scatterplot of the data for the female subjects. Which is the explanatory variable? (b) Is the association between these variables positive or negative? What is the form of the relationship? How strong is the relationship? (c) Now add the data for the male subjects to your graph, using a different color or a different plotting symbol. Does the pattern of the relationship that you observed in (b) hold for men also? How do the male subjects as a group differ from the female subjects as a group? 5. Who burns more energy? Table 14.1 gives data on the lean body mass and metabolic rate for 12 women and 7 men. You made a scatterplot of these data in Exercise 14.14. Use your calculator to do the following: groups? Why? (a) Do you think the correlation will be about the same for men and women or quite different for the two (b) Calculate r for women alone and also for men alone. (Use your calculator.) 6. Body mass and metabolic rate. The body mass data in Table 14.1 are given in pounds. There are 2.2 pounds in a kilogram. If we changed the data from pounds to kilograms, how would the mean body mass change? How would the correlation between body mass and metabolic rate change?3:52 4 II" '5" C] E courses.cscc.edu C Stat 1350 Elementary Statistics Graded HomeworkAssignment 8 Unit 7 1. Living on campus. A February 2, 2008, article in the Columbus Dispatch reported a study on the distances students lived from campus and average GPA. Here is a summary of the results: Residence Avg. GPA Residence hall 3.33 Walking distance 3.16 Near campus. long walk or short drive 3.12 Within the county. not near campus 2.97 Outside the county 2.94 Based on these data, is the association between the distance a student lives from campus and average GPA positive, negative, or near 0? 2. Calories and salt in hot dogs. The scatterplot below shows the calories and sodium content in 17 brands of meat hot dogs. Describe the overall pattern of these data. In what way is the point marked A unusual? 600 Sodlum per hot dog (milligrlma) 120 140 180 180 Calories per hot dog 3. Is the correlation r for the data in exercise 2 near -1, clearly negative but not near -1, near 0, clearly positive but not near I, or near 1? Explain your answer. 4. Who burns more energy? Metabolic rate, the rate at which the body consumes energy, is important in studies of weight gain, dieting, and exercises Table 14.] gives data on the lean body mass and resting metabolic rate for [2 women and 7 men who are subjects in a study of dieting. Lean body mass, given in pounds, is a person's weight leaving out all fat. Metabolic rate is measured in calories burned per 24 hours, the same calories used to describe the energy content of foods. The researchers believe that lean body mass is an important inuence on metabolic rate. TABLE ".1 Leanbodynmsandmbollcrate Subject Sex Muse (lb) Rate (col) Subject Sex Mace (lb) Bate (cal) m 3:53 9 A courses . cscc . edu ( d ) Based on your work in ( a ) , ( 6 ) , and ( C ) , do you think that counting stumps offers a quick and reliable way to predict beetle larvae clusters ?* 10 . Strong association but no correlation . Here are data on the speed ( miles per hour ) and mileage ( miles per gallon) of a car :\\ Speed :` 25 35 45 55 65 Mileage :" 20 24 26 24 20 The least- squares line for predicting mileage from speed is mileage = 22.8 + ( 0 x speed ) ( a ) Make a scatterplot of the data and draw this line on the plot .* ( b) The correlation between mileage and speed is * = 0 . What does this say about the usefulness of the regression equation ?" 1 1 . Health and wealth . An article entitled" The Health and Wealth of Nations " says :" The positive correlation between health and income per capita is one of the best - known relations in international development . This correlation is commonly thought to reflect a causal link running from income to health . Recently , however , another intriguing possibility has emerged : that the health- income correlation is partly explained by a causal link running the other way from health to income ." Explain how higher income in a nation can cause better health . Then explain how better health can cause higher income . There is no simple way to determine the direction of the link ."
Step by Step Solution
There are 3 Steps involved in it

Get step-by-step solutions from verified subject matter experts


