

Answered step by step
Verified Expert Solution
Question
1 Approved Answer
United States Mexico Tank 1 hour 2 hours Taco 1 minute 1.5 minutes a. Who has the absolute advantage in tank production? Taco production?
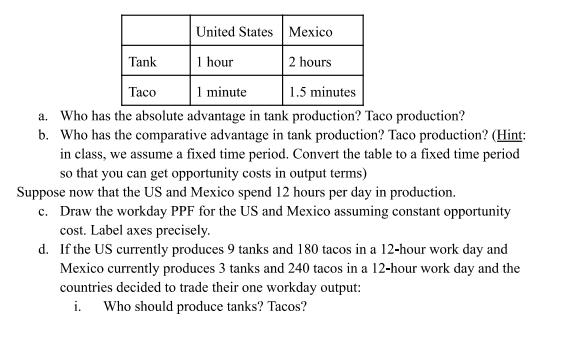
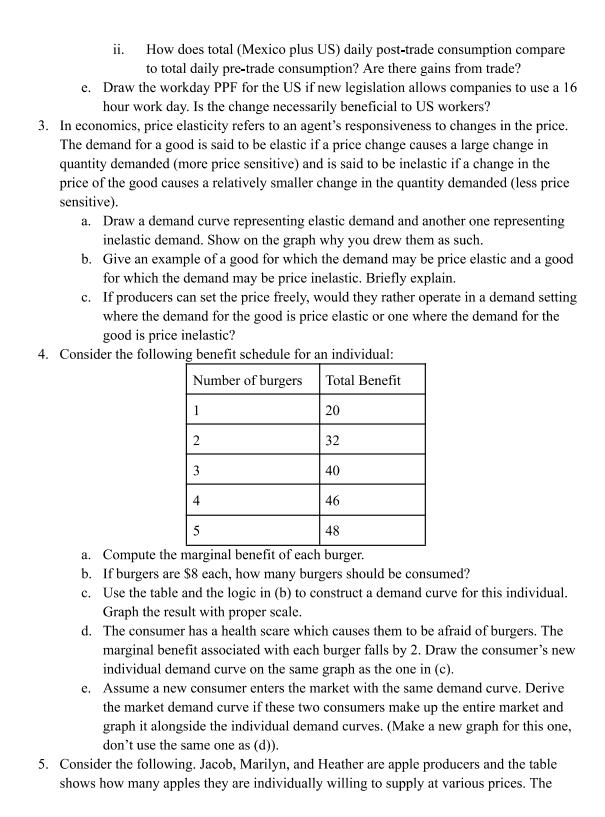
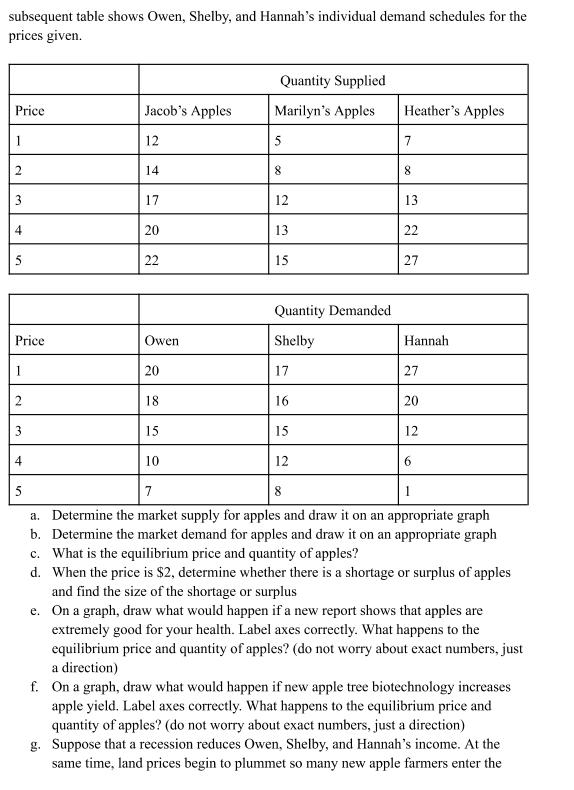
United States Mexico Tank 1 hour 2 hours Taco 1 minute 1.5 minutes a. Who has the absolute advantage in tank production? Taco production? b. Who has the comparative advantage in tank production? Taco production? (Hint: in class, we assume a fixed time period. Convert the table to a fixed time period so that you can get opportunity costs in output terms) Suppose now that the US and Mexico spend 12 hours per day in production. c. Draw the workday PPF for the US and Mexico assuming constant opportunity cost. Label axes precisely. d. If the US currently produces 9 tanks and 180 tacos in a 12-hour work day and Mexico currently produces 3 tanks and 240 tacos in a 12-hour work day and the countries decided to trade their one workday output: i. Who should produce tanks? Tacos? ii. How does total (Mexico plus US) daily post-trade consumption compare to total daily pre-trade consumption? Are there gains from trade? e. Draw the workday PPF for the US if new legislation allows companies to use a 16 hour work day. Is the change necessarily beneficial to US workers? 3. In economics, price elasticity refers to an agent's responsiveness to changes in the price. The demand for a good is said to be elastic if a price change causes a large change in quantity demanded (more price sensitive) and is said to be inelastic if a change in the price of the good causes a relatively smaller change in the quantity demanded (less price sensitive). a. Draw a demand curve representing elastic demand and another one representing inelastic demand. Show on the graph why you drew them as such. b. Give an example of a good for which the demand may be price elastic and a good for which the demand may be price inelastic. Briefly explain. c. If producers can set the price freely, would they rather operate in a demand setting where the demand for the good is price elastic or one where the demand for the good is price inelastic? 4. Consider the following benefit schedule for an individual: Number of burgers Total Benefit 1 20 32 3 40 4 46 5 48 a. Compute the marginal benefit of each burger. b. If burgers are $8 each, how many burgers should be consumed? c. Use the table and the logic in (b) to construct a demand curve for this individual. Graph the result with proper scale. d. The consumer has a health scare which causes them to be afraid of burgers. The marginal benefit associated with each burger falls by 2. Draw the consumer's new individual demand curve on the same graph as the one in (c). e. Assume a new consumer enters the market with the same demand curve. Derive the market demand curve if these two consumers make up the entire market and graph it alongside the individual demand curves. (Make a new graph for this one, don't use the same one as (d)). 5. Consider the following. Jacob, Marilyn, and Heather are apple producers and the table shows how many apples they are individually willing to supply at various prices. The subsequent table shows Owen, Shelby, and Hannah's individual demand schedules for the prices given. Quantity Supplied Price Jacob's Apples Marilyn's Apples Heather's Apples 1 12 5 7 2 14 8 8 3 17 12 13 4 20 13 22 5 22 15 27 Quantity Demanded Price Owen Shelby Hannah 1 20 17 27 2 18 16 20 3 15 15 12 4 5 10 12 6 7 8 1 a. Determine the market supply for apples and draw it on an appropriate graph b. Determine the market demand for apples and draw it on an appropriate graph c. What is the equilibrium price and quantity of apples? d. When the price is $2, determine whether there is a shortage or surplus of apples and find the size of the shortage or surplus e. On a graph, draw what would happen if a new report shows that apples are extremely good for your health. Label axes correctly. What happens to the equilibrium price and quantity of apples? (do not worry about exact numbers, just a direction) f. On a graph, draw what would happen if new apple tree biotechnology increases apple yield. Label axes correctly. What happens to the equilibrium price and quantity of apples? (do not worry about exact numbers, just a direction) g. Suppose that a recession reduces Owen, Shelby, and Hannah's income. At the same time, land prices begin to plummet so many new apple farmers enter the market. Show on a graph what happens to the equilibrium price and quantity of apples. Assume apples are a normal good.
Step by Step Solution
There are 3 Steps involved in it
Step: 1

Get Instant Access to Expert-Tailored Solutions
See step-by-step solutions with expert insights and AI powered tools for academic success
Step: 2

Step: 3
Ace Your Homework with AI
Get the answers you need in no time with our AI-driven, step-by-step assistance
Get Started
Principles of Economics
Authors: Gregory Mankiw
7th edition
128516587X, 978-1285165875