Answered step by step
Verified Expert Solution
Question
1 Approved Answer
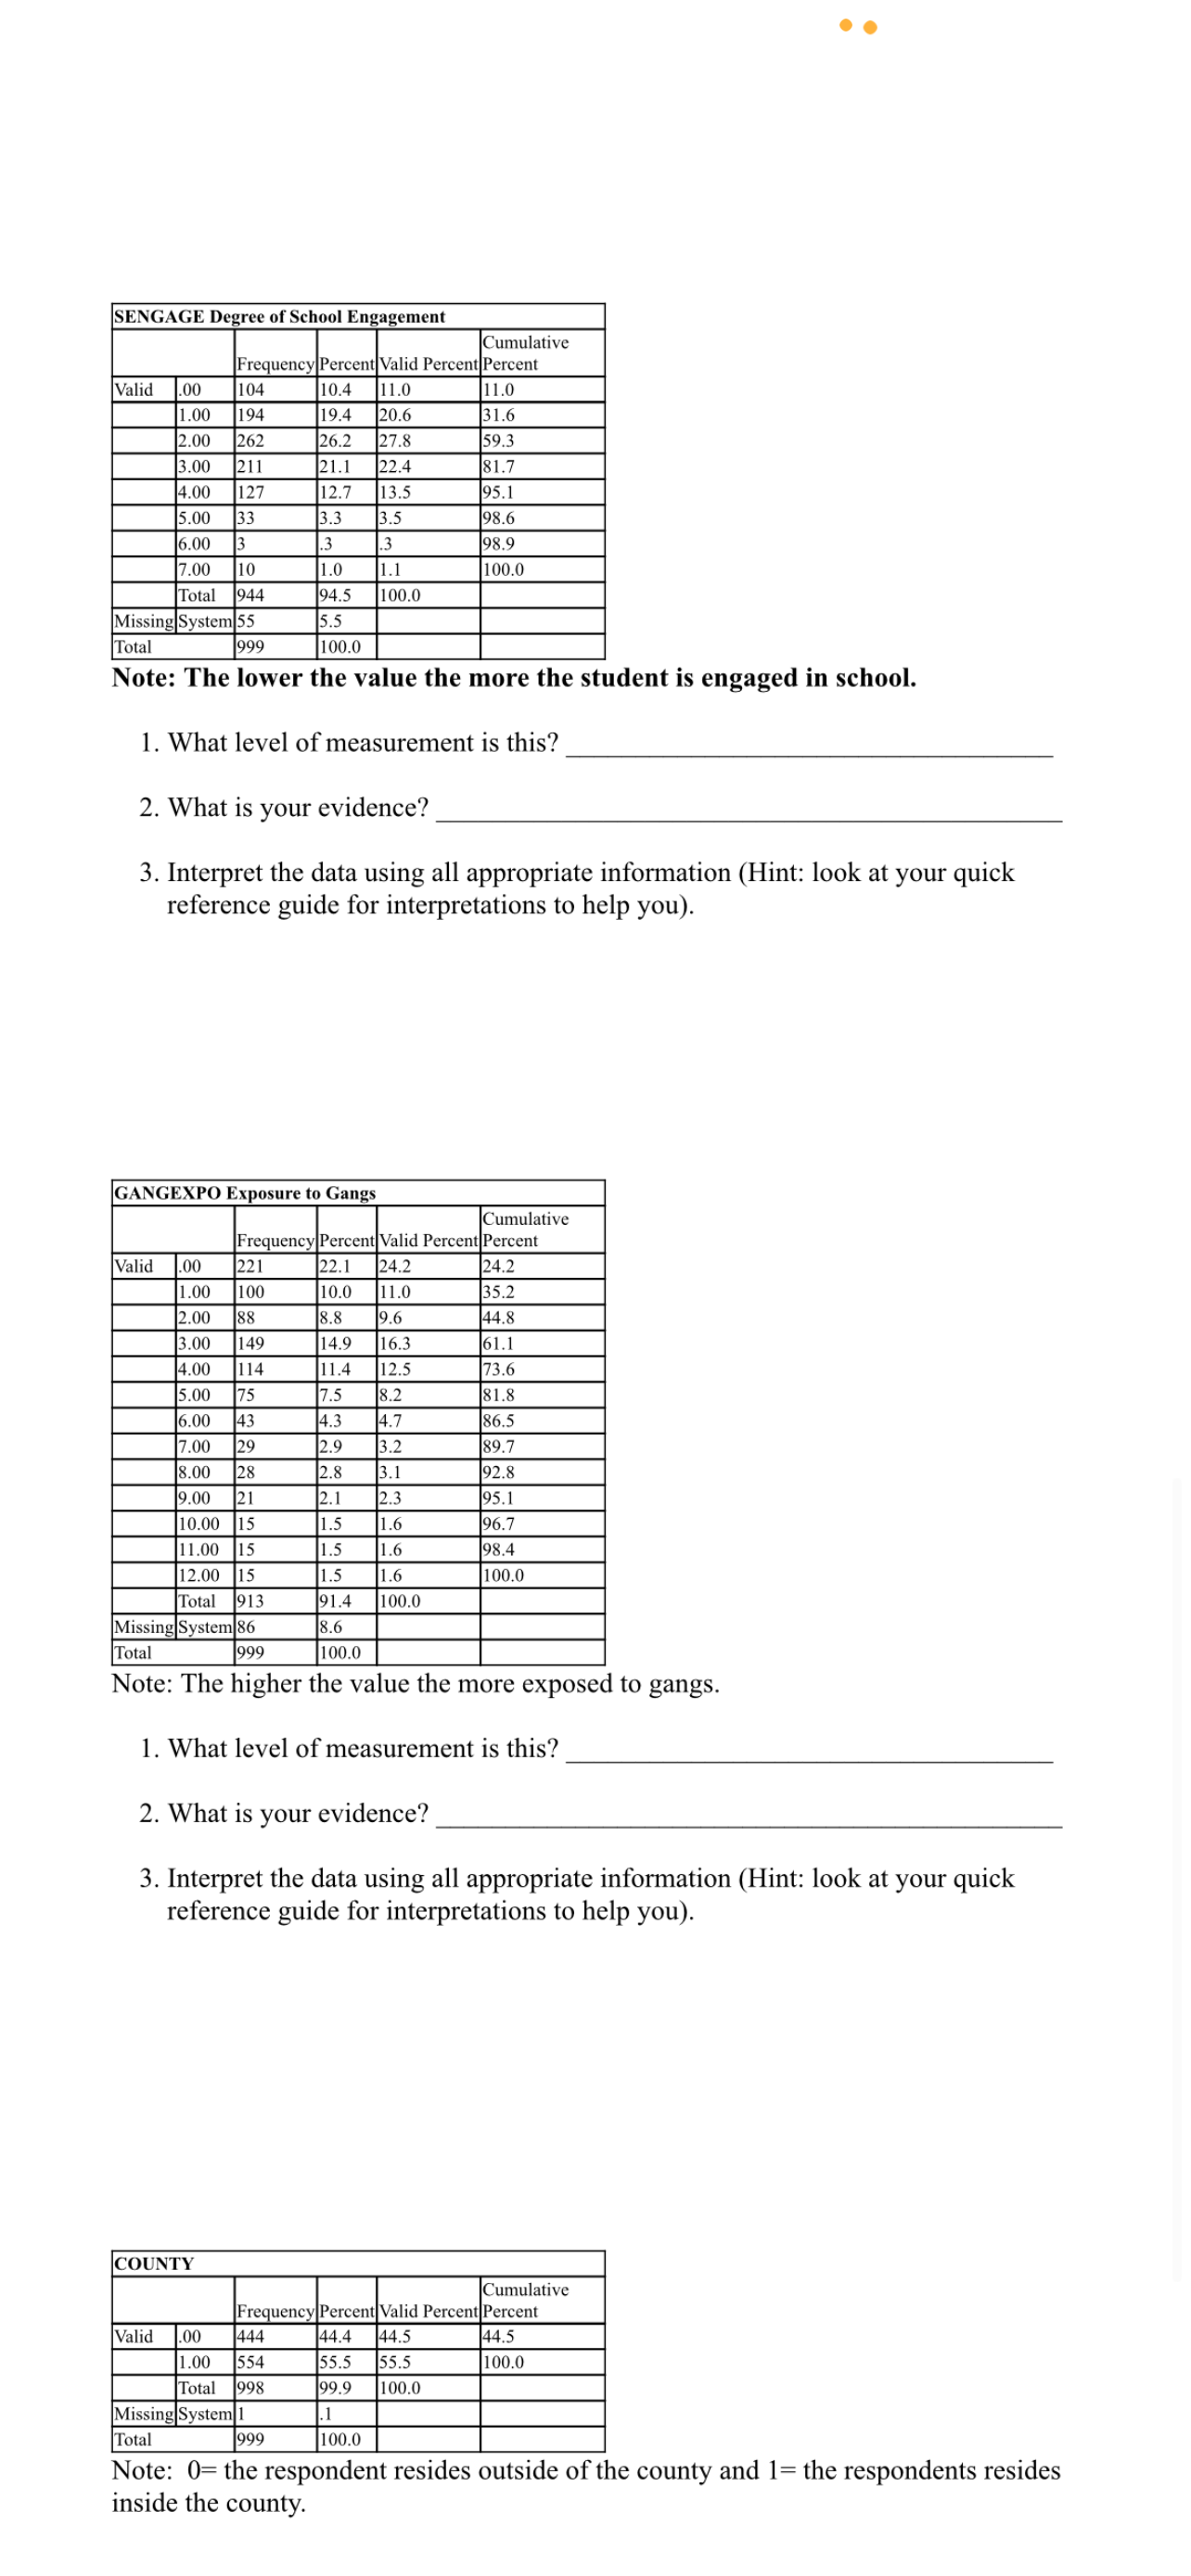
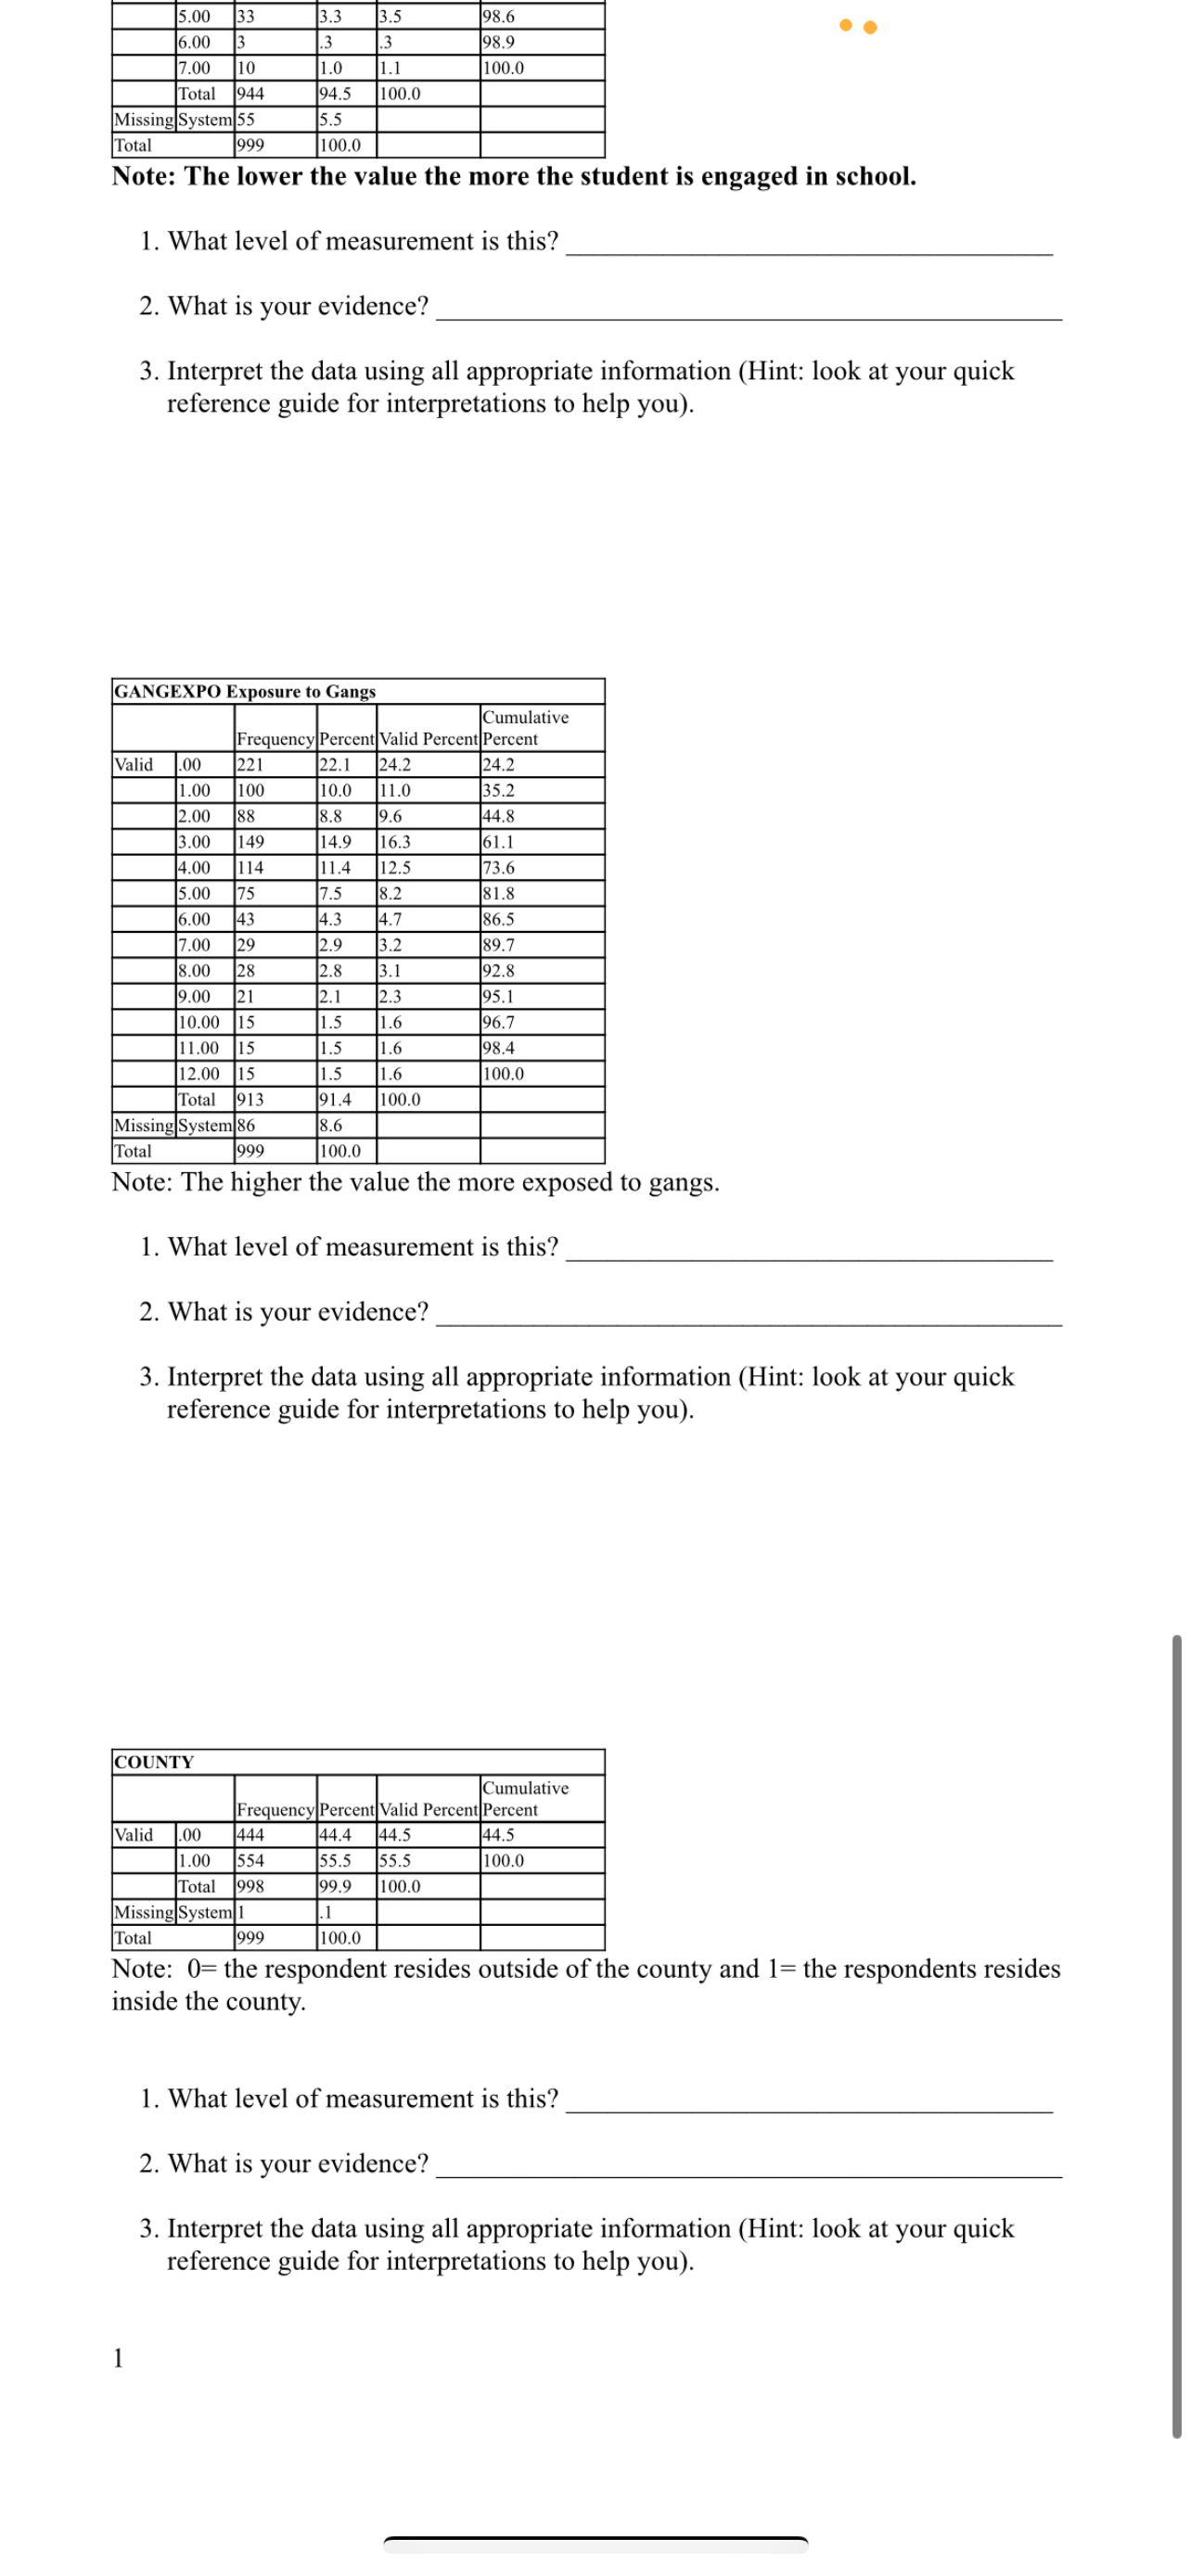
UNIVARIATE INTERPRETATIONS PRACTICE SHEET Directions: Review the SPSS print out and answer the questions below each variable in the Frequency Table. Please note the amount
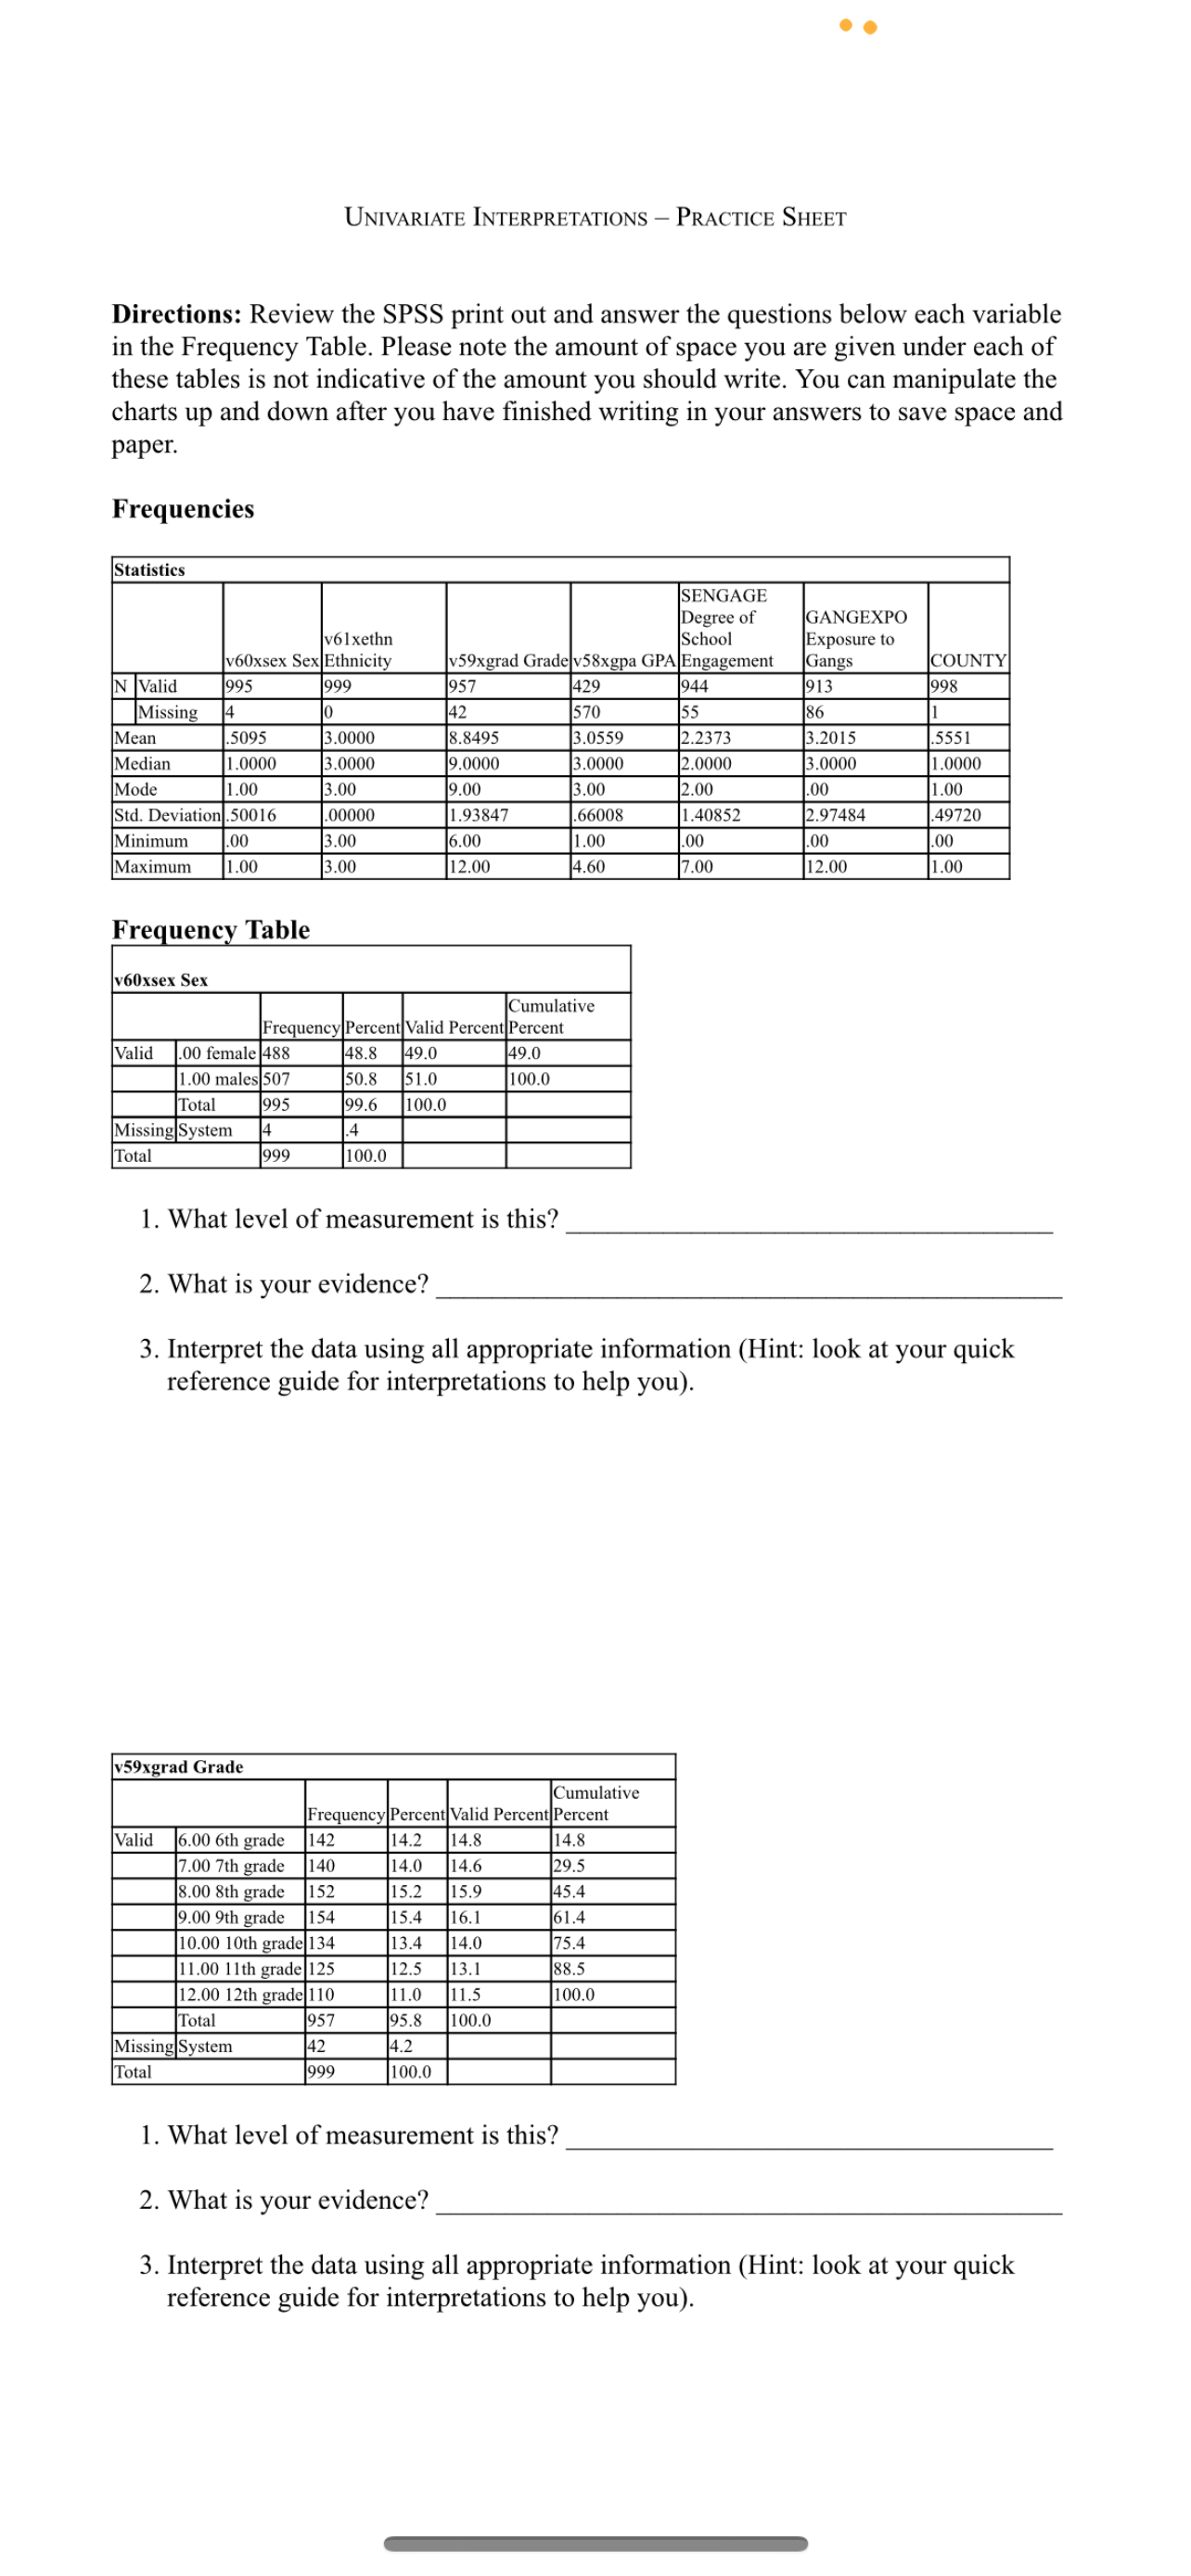
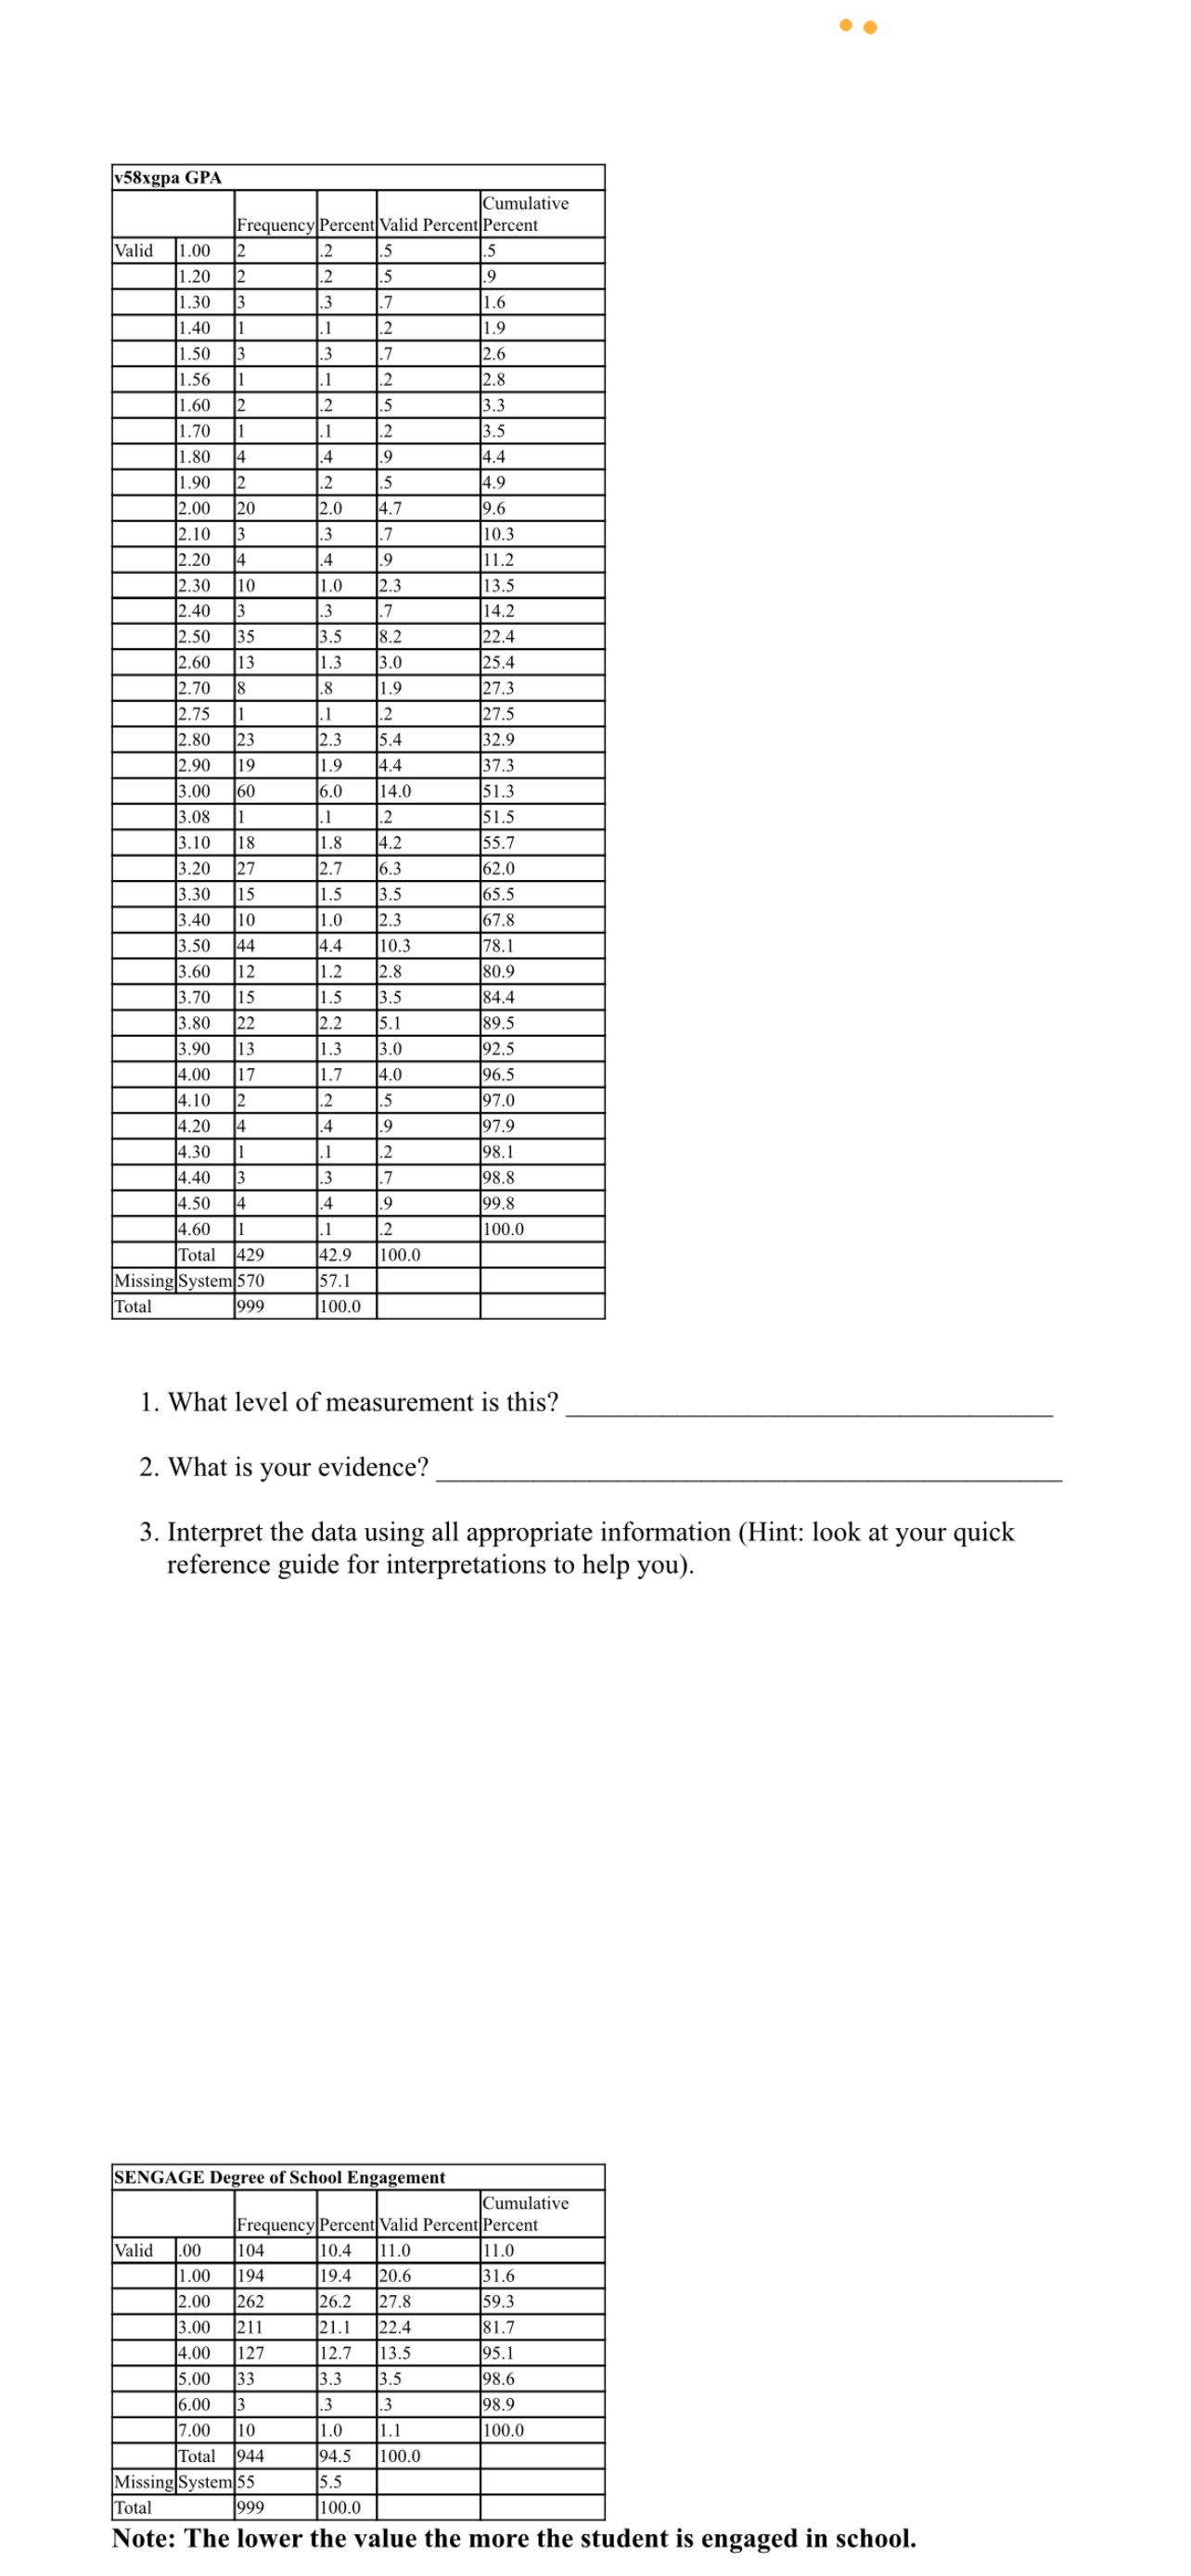
UNIVARIATE INTERPRETATIONS PRACTICE SHEET Directions: Review the SPSS print out and answer the questions below each variable in the Frequency Table. Please note the amount of space you are given under each of these tables is not indicative of the amount you should write. You can manipulate the charts up and down after you have finished writing in your answers to save space and paper. Frequencies Statistics IGANGEXPO v61xethn Exposure to (Gangs 913 1.0000 3.0000 19.0000 3.0000 2.0000 13.0000 1.0000 ~ Il_ Median Mode Std. Deviation|. Minimum Maximum Frequency Table v60xsex Sex Missing| Sy\\!em 1. What level of measurement is this? 2. What is your evidence? 3. Interpret the data using all appropriate information (Hint: look at your quick reference guide for interpretations to help you). v59xgrad Grade [Cumulative Valid ol 57 foss oo [ | MissinglSystem 12 M2 | [ | 1. What level of measurement is this? 2. What is your evidence? 3. Interpret the data using all appropriate information (Hint: look at your quick reference guide for interpretations to help you). . v58xgpa GPA Cumulative Frequency Percent Valid Percent Percent Valid 1.00 2 1.2 1.20 2 2 1.30 T.3 19 1.40 1.6 3 .3 2.6 1.56 1.60 2 .2 1.70 1 1.80 4 4 1.90 .2 2.00 20 2.0 2.10 2.20 4 2.30 10 1.0 2.40 two 3 2.50 35 3.5 2.60 13 1.3 3.0 2.70 .8 1.9 27.3 2.75 .1 .2 27.5 2.80 23 2.3 5.4 32.9 2.90 19 1.9 4.4 137.3 3.00 60 6.0 14.0 151.3 3.08 .1 .2 51.5 3.10 18 1.8 4.2 155.7 3.20 27 2.7 6.3 62.0 3.30 15 1.5 3.5 65.5 3.40 10 1.0 2.3 67.8 3.50 44 4.4 10.3 78.1 3.60 12 1.2 2.8 80.9 3.70 15 1.5 3.5 84.4 3.80 22 2.2 5.1 189.5 3.90 13 1.3 3.0 192.5 4.00 17 1.7 4.0 196.5 4.10 2 .5 197.0 4.20 4 4 1.9 197.9 4.30 .1 1.2 198.1 4.40 3 .3 .7 98.8 4.50 1.4 99.8 4.60 . 1 12 100.0 Total 42.9 100.0 Missing System 570 57.1 Total 1999 100.0 1. What level of measurement is this? 2. What is your evidence? 3. Interpret the data using all appropriate information (Hint: look at your quick reference guide for interpretations to help you). SENGAGE Degree of School Engagement Cumulative Frequency Percent Valid Percent Percent Valid 104 10.4 11.0 11.0 1.00 194 19.4 20.6 31.6 2.00 262 26.2 27.8 59.3 3.00 211 21.1 22.4 81.7 4.00 127 12.7 13.5 95.1 5.00 33 3.3 3.5 98.6 6.00 .3 .3 98.9 7.00 10 1.0 1.1 100.0 Total 944 94.5 100.0 Missing System 55 5.5 Total 999 100.0 Note: The lower the value the more the student is engaged in school.SENGAGE Degree of School Engagement s fw s b Missing Total Note: The lower the value the more the student is engaged in school. 1. What level of measurement is this? 2. What is your evidence? 3. Interpret the data using all appropriate information (Hint: look at your quick reference guide for interpretations to help you). GANGEXPO Exposure to Gangs (Cumulative [Frequency|Percent|Valid Percent|Percent 24.2 35.2 144.8 61.1 73.6 81.8 86.5 89.7 92.8 95.1 10 00 K 96.7 11.00 E 98.4 12.00 i 100.0 Missing] Total Note: The higher the value the more exposed to gangs. 1. What level of measurement is this? 2. What is your evidence? 3. Interpret the data using all appropriate information (Hint: look at your quick reference guide for interpretations to help you). COUNTY [Cumulative [Frequency|Percent|Valid Percent| Percem Valid -_- 100.0 Note: 0= the respondent resides outside of the county and 1= the respondents resides inside the county. - ; fow P ool 1 ] Note: The lower the value the more the student is engaged in school. 1. What level of measurement is this? 2. What is your evidence? 3. Interpret the data using all appropriate information (Hint: look at your quick reference guide for interpretations to help you). GANGEXPO Exposure to Gangs [Cumulative [Frequency[Percent|Valid Percent|Percent 24.2 35.2 144.8 61.1 73.6 31.8 86.5 89.7 92.8 9.00 95.1 21 E 3 10.00 |15 i . 96.7 L 100.0 foul 1ol _iooo Misiglsysenss o6 | Total 999 100.0 Note: The higher the value the more exposed to gangs. Valid 1. What level of measurement is this? 2. What is your evidence? 3. Interpret the data using all appropriate information (Hint: look at your quick reference guide for interpretations to help you). COUNTY 1.00 [Total (998 Note: 0= the respondent resides outside of the county and 1= the respondents resides inside the county. 1. What level of measurement is this? 2. What is your evidence? 3. Interpret the data using all appropriate information (Hint: look at your quick reference guide for interpretations to help you)
Step by Step Solution
There are 3 Steps involved in it
Step: 1
Get Instant Access to Expert-Tailored Solutions
See step-by-step solutions with expert insights and AI powered tools for academic success
Step: 2
Step: 3
Ace Your Homework with AI
Get the answers you need in no time with our AI-driven, step-by-step assistance
Get Started