Question
Update: Heres a transcript of the file This program will draw a line using PennSims graphics display. Your program will input the slope and intercept
Update:
Heres a transcript of the file
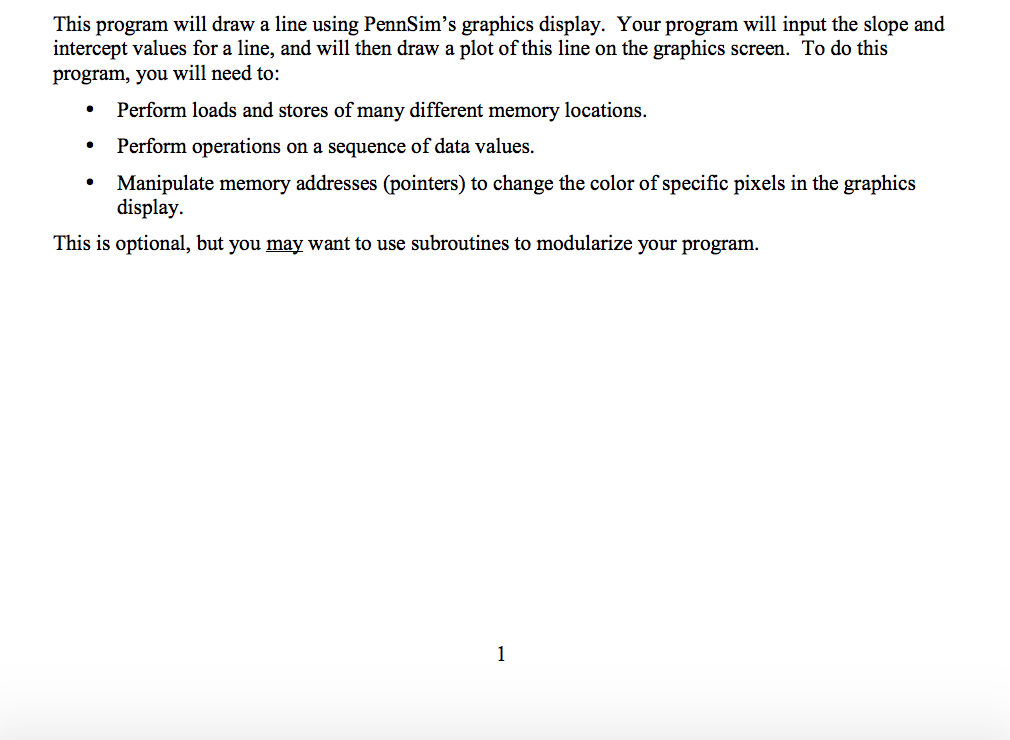
This program will draw a line using PennSims graphics display. Your program will input the slope and intercept values for a line, and will then draw a plot of this line on the graphics screen. To do this program, you will need to:
? Perform loads and stores of many different memory locations.
? Perform operations on a sequence of data values.
? Manipulate memory addresses (pointers) to change the color of specific pixels in the graphics display.
This is optional, but you may want to use subroutines to modularize your program.
Background
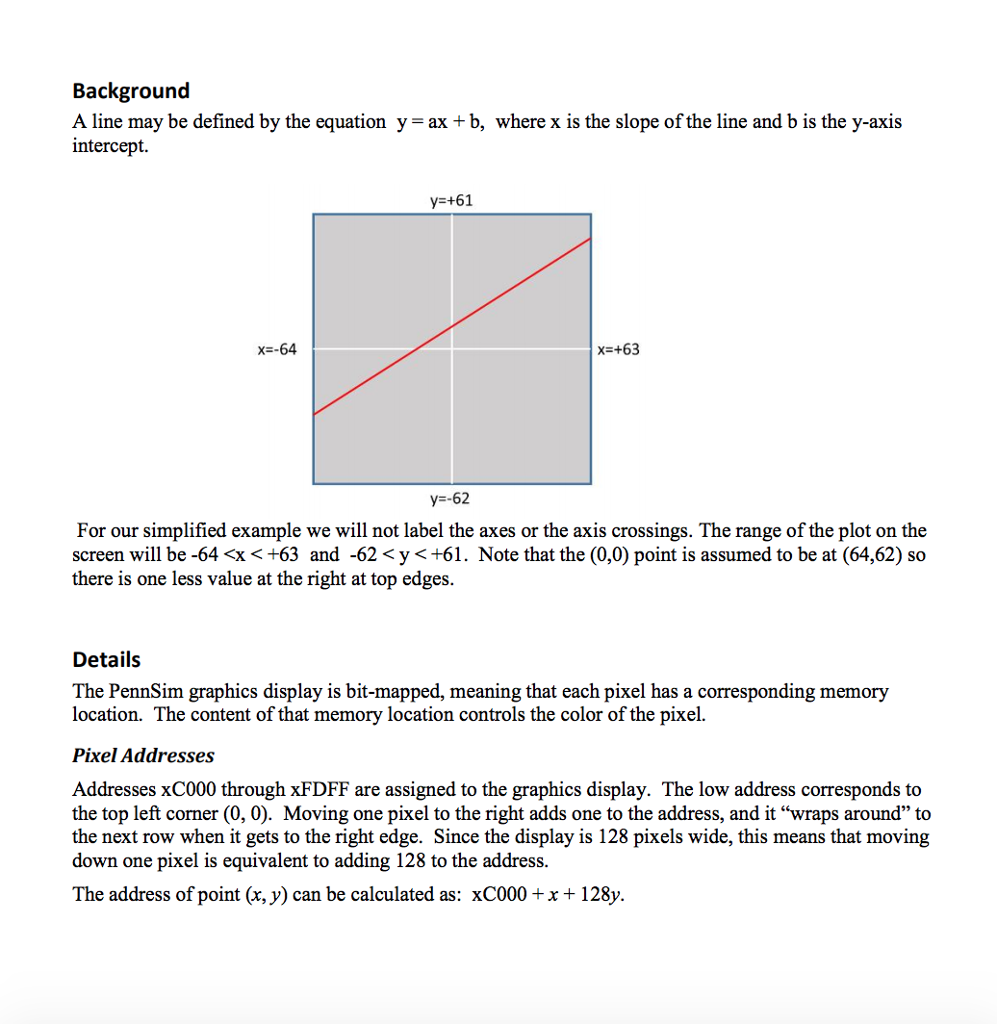
A line may be defined by the equation y = ax + b, where x is the slope of the line and b is the y-axis intercept.
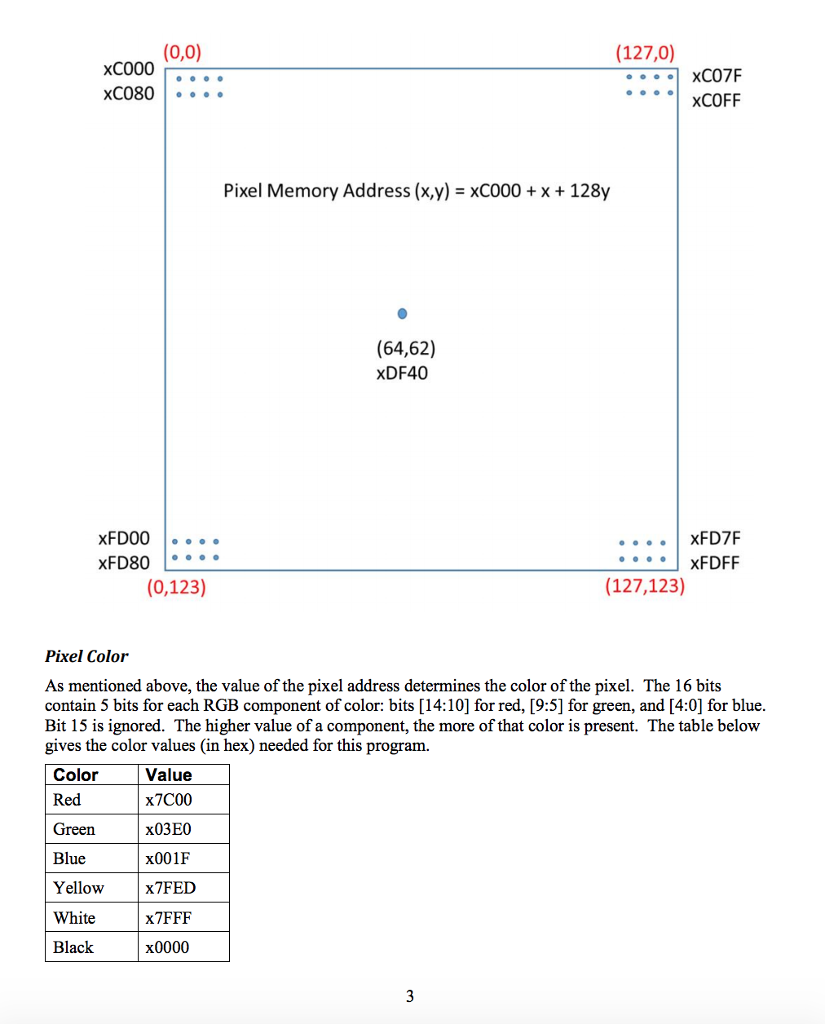
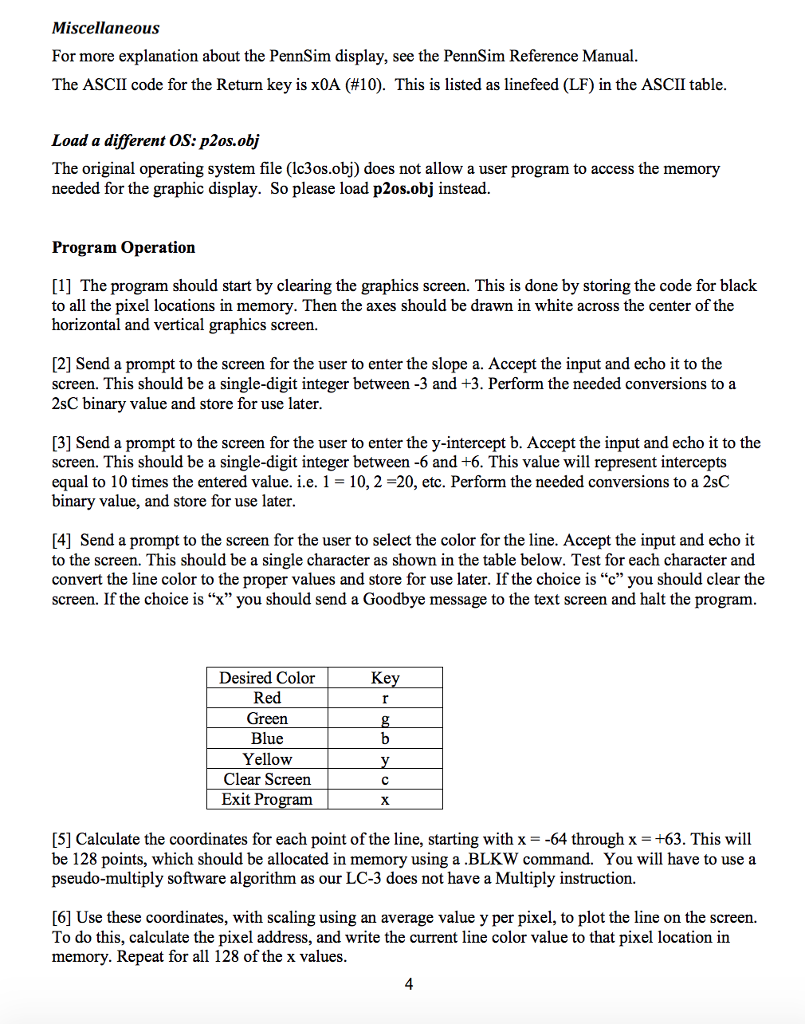
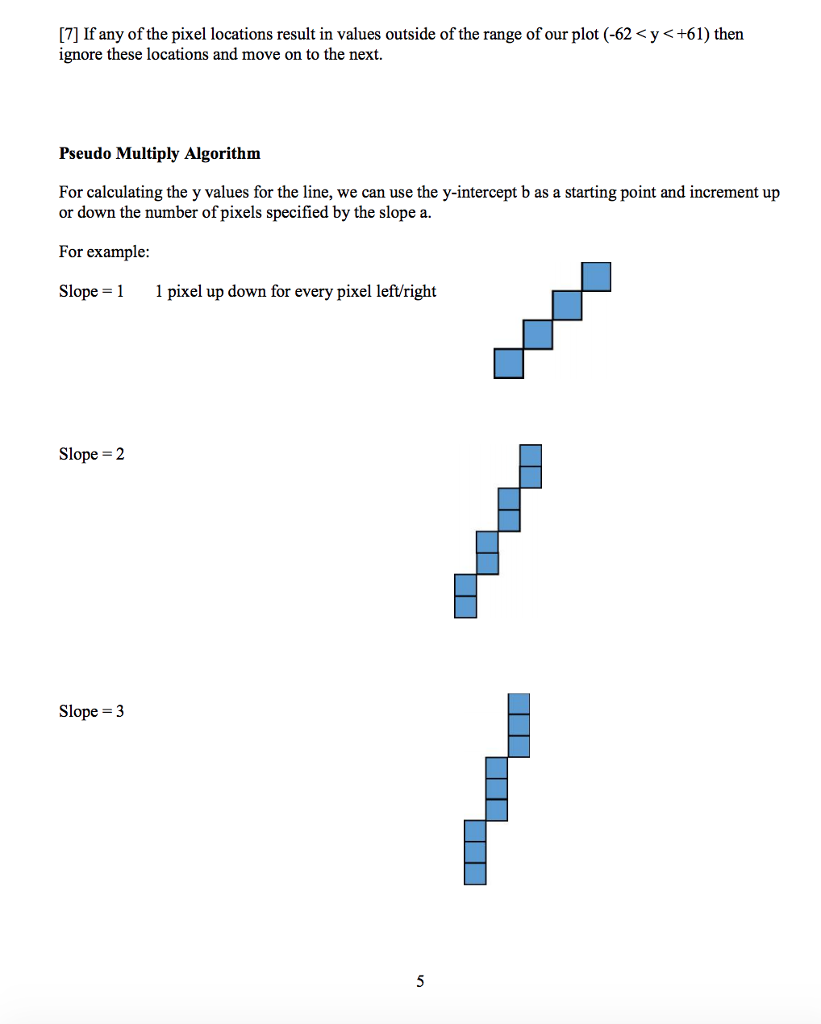
For our simplified example we will not label the axes or the axis crossings. The range of the plot on the screen will be -64 Details The PennSim graphics display is bit-mapped, meaning that each pixel has a corresponding memory location. The content of that memory location controls the color of the pixel. Pixel Addresses Addresses xC000 through xFDFF are assigned to the graphics display. The low address corresponds to the top left corner (0, 0). Moving one pixel to the right adds one to the address, and it wraps around to the next row when it gets to the right edge. Since the display is 128 pixels wide, this means that moving down one pixel is equivalent to adding 128 to the address. The address of point (x, y) can be calculated as: xC000 + x + 128y. Pixel Color As mentioned above, the value of the pixel address determines the color of the pixel. The 16 bits contain 5 bits for each RGB component of color: bits [14:10] for red, [9:5] for green, and [4:0] for blue. Bit 15 is ignored. The higher value of a component, the more of that color is present. The table below gives the color values (in hex) needed for this program. Color Value Red x7C00 Green x03E0 Blue x001F Yellow x7FED White x7FFF Black x0000 Miscellaneous For more explanation about the PennSim display, see the PennSim Reference Manual. The ASCII code for the Return key is x0A (#10). This is listed as linefeed (LF) in the ASCII table. Load a different OS: p2os.obj The original operating system file (lc3os.obj) does not allow a user program to access the memory needed for the graphic display. So please load p2os.obj instead. Program Operation [1] The program should start by clearing the graphics screen. This is done by storing the code for black to all the pixel locations in memory. Then the axes should be drawn in white across the center of the horizontal and vertical graphics screen. [2] Send a prompt to the screen for the user to enter the slope a. Accept the input and echo it to the screen. This should be a single-digit integer between -3 and +3. Perform the needed conversions to a 2sC binary value and store for use later. [3] Send a prompt to the screen for the user to enter the y-intercept b. Accept the input and echo it to the screen. This should be a single-digit integer between -6 and +6. This value will represent intercepts equal to 10 times the entered value. i.e. 1 = 10, 2 =20, etc. Perform the needed conversions to a 2sC binary value, and store for use later. [4] Send a prompt to the screen for the user to select the color for the line. Accept the input and echo it to the screen. This should be a single character as shown in the table below. Test for each character and convert the line color to the proper values and store for use later. If the choice is c you should clear the screen. If the choice is x you should send a Goodbye message to the text screen and halt the program. Desired Color Key Red r Green g Blue b Yellow y Clear Screen c Exit Program x [5] Calculate the coordinates for each point of the line, starting with x = -64 through x = +63. This will be 128 points, which should be allocated in memory using a .BLKW command. You will have to use a pseudo-multiply software algorithm as our LC-3 does not have a Multiply instruction. [6] Use these coordinates, with scaling using an average value y per pixel, to plot the line on the screen. To do this, calculate the pixel address, and write the current line color value to that pixel location in memory. Repeat for all 128 of the x values. [7] If any of the pixel locations result in values outside of the range of our plot (-62 Pseudo Multiply Algorithm For calculating the y values for the line, we can use the y-intercept b as a starting point and increment up or down the number of pixels specified by the slope a. For example: Slope = 1 1 pixel up down for every pixel left/right Slope = 2 2 pixel up down for every pixel left/right Slope = 3 3 pixel up down for every pixel left/right
Step by Step Solution
There are 3 Steps involved in it
Step: 1

Get Instant Access to Expert-Tailored Solutions
See step-by-step solutions with expert insights and AI powered tools for academic success
Step: 2

Step: 3

Ace Your Homework with AI
Get the answers you need in no time with our AI-driven, step-by-step assistance
Get Started


