

Question
Updated Relative Valuation: Use the multiples provided in Exhibit 2 to conduct relative valuations of ORN; For simplicity, base your analysis on the Median EV/EBITDA-ratio
Updated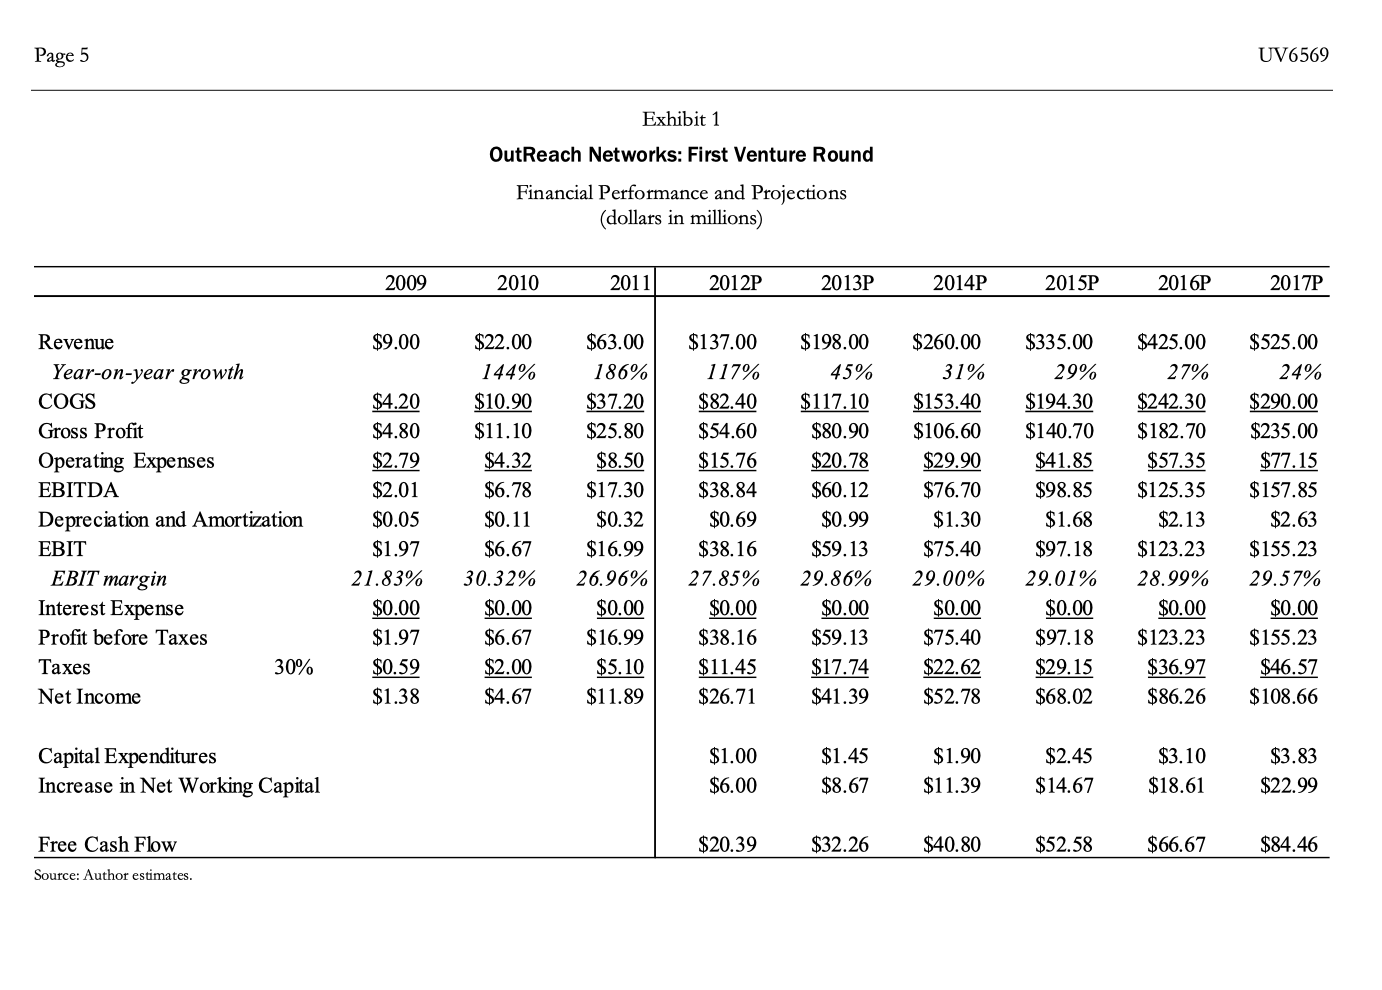
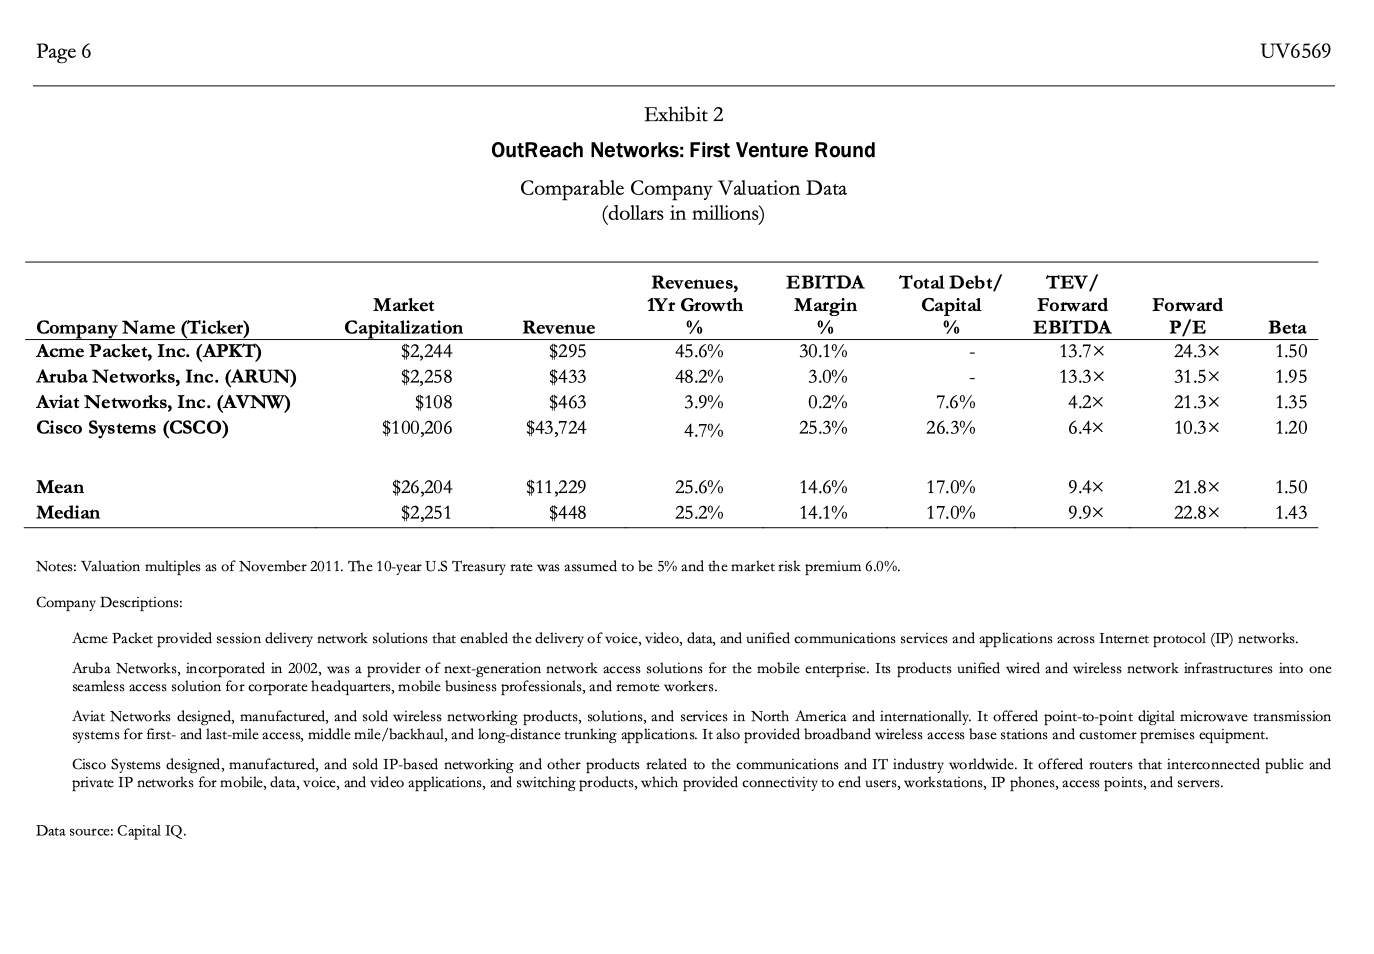
Relative Valuation: Use the multiples provided in Exhibit 2 to conduct relative valuations of ORN;
For simplicity, base your analysis on the Median EV/EBITDA-ratio as well as the Median P/E-ratio presented in that Exhibit.
No additional relative valuations are required at this stage.
Page 5 UV6569 Exhibit 1 OutReach Networks: First Venture Round Financial Performance and Projections (dollars in millions) 2009 2010 2011 2012P 2013P 2014P 2015P 2016P 2017P $9.00 Revenue Year-on-year growth COGS Gross Profit Operating Expenses EBITDA Depreciation and Amortization EBIT EBIT margin Interest Expense Profit before Taxes Taxes 30% Net Income $4.20 $4.80 $2.79 $2.01 $0.05 $1.97 21.83% $0.00 $1.97 $0.59 $1.38 $22.00 144% $10.90 $11.10 $4.32 $6.78 $0.11 $6.67 30.32% $0.00 $6.67 $2.00 $4.67 $63.00 186% $37.20 $25.80 $8.50 $17.30 $0.32 $16.99 26.96% $0.00 $16.99 $5.10 $11.89 $137.00 117% $82.40 $54.60 $15.76 $38.84 $0.69 $38.16 27.85% $0.00 $38.16 $11.45 $26.71 $198.00 45% $117.10 $80.90 $20.78 $60.12 $0.99 $59.13 29.86% $0.00 $59.13 $17.74 $41.39 $260.00 31% $153.40 $106.60 $29.90 $76.70 $1.30 $75.40 29.00% $0.00 $75.40 $22.62 $52.78 $335.00 29% $194.30 $140.70 $41.85 $98.85 $1.68 $97.18 29.01% $0.00 $97.18 $29.15 $68.02 $425.00 27% $242.30 $182.70 $57.35 $125.35 $2.13 $123.23 28.99% $0.00 $123.23 $36.97 $86.26 $525.00 24% $290.00 $235.00 $77.15 $157.85 $2.63 $155.23 29.57% $0.00 $155.23 $46.57 $108.66 Capital Expenditures Increase in Net Working Capital $1.00 $6.00 $1.45 $8.67 $1.90 $11.39 $2.45 $14.67 $3.10 $18.61 $3.83 $22.99 Free Cash Flow $20.39 $32.26 $40.80 $52.58 $66.67 $84.46 Author estima Page 6 UV6569 Exhibit 2 OutReach Networks: First Venture Round Comparable Company Valuation Data (dollars in millions) Total Debt/ Capital % Beta Company Name (Ticker) Acme Packet, Inc. (APKT) Aruba Networks, Inc. (ARUN) Aviat Networks, Inc. (AVNW) Cisco Systems (CSCO) Market Capitalization $2,244 $2,258 $108 $100,206 Revenue $295 $433 $463 $43,724 Revenues, 1Yr Growth % 45.6% 48.2% 3.9% EBITDA Margin % 30.1% 3.0% 0.2% 25.3% TEV/ Forward EBITDA 13.7% 13.3x 4.2x 6.4x Forward P/E 24.3x 31.5% 21.3x 10.3% 1.50 1.95 1.35 1.20 7.6% 26.3% 4.7% Mean Median $26,204 $2,251 $11,229 $448 25.6% 25.2% 14.6% 14.1% 17.0% 17.0% 9.4x 9.9x 21.8% 22.8x 1.50 1.43 Notes: Valuation multiples as of November 2011. The 10-year U.S Treasury rate was assumed to be 5% and the market risk premium 6.0%. Company Descriptions: Acme Packet provided session delivery network solutions that enabled the delivery of voice, video, data, and unified communications services and applications across Internet protocol (IP) networks. Aruba Networks, incorporated in 2002, was a provider of next-generation network access solutions for the mobile enterprise. Its products unified wired and wireless network infrastructures into one seamless access solution for corporate headquarters, mobile business professionals, and remote workers. Aviat Networks designed, manufactured, and sold wireless networking products, solutions, and services in North America and internationally. It offered point-to-point digital microwave transmission systems for first- and last-mile access, middle mile/backhaul, and long-distance trunking applications. It also provided broadband wireless access base stations and customer premises equipment. Cisco Systems designed, manufactured, and sold IP-based networking and other products related to the communications and IT industry worldwide. It offered routers that interconnected public and private IP networks for mobile, data, voice, and video applications, and switching products, which provided connectivity to end users, workstations, IP phones, access points, and servers. Data source: Capital IQ. Page 5 UV6569 Exhibit 1 OutReach Networks: First Venture Round Financial Performance and Projections (dollars in millions) 2009 2010 2011 2012P 2013P 2014P 2015P 2016P 2017P $9.00 Revenue Year-on-year growth COGS Gross Profit Operating Expenses EBITDA Depreciation and Amortization EBIT EBIT margin Interest Expense Profit before Taxes Taxes 30% Net Income $4.20 $4.80 $2.79 $2.01 $0.05 $1.97 21.83% $0.00 $1.97 $0.59 $1.38 $22.00 144% $10.90 $11.10 $4.32 $6.78 $0.11 $6.67 30.32% $0.00 $6.67 $2.00 $4.67 $63.00 186% $37.20 $25.80 $8.50 $17.30 $0.32 $16.99 26.96% $0.00 $16.99 $5.10 $11.89 $137.00 117% $82.40 $54.60 $15.76 $38.84 $0.69 $38.16 27.85% $0.00 $38.16 $11.45 $26.71 $198.00 45% $117.10 $80.90 $20.78 $60.12 $0.99 $59.13 29.86% $0.00 $59.13 $17.74 $41.39 $260.00 31% $153.40 $106.60 $29.90 $76.70 $1.30 $75.40 29.00% $0.00 $75.40 $22.62 $52.78 $335.00 29% $194.30 $140.70 $41.85 $98.85 $1.68 $97.18 29.01% $0.00 $97.18 $29.15 $68.02 $425.00 27% $242.30 $182.70 $57.35 $125.35 $2.13 $123.23 28.99% $0.00 $123.23 $36.97 $86.26 $525.00 24% $290.00 $235.00 $77.15 $157.85 $2.63 $155.23 29.57% $0.00 $155.23 $46.57 $108.66 Capital Expenditures Increase in Net Working Capital $1.00 $6.00 $1.45 $8.67 $1.90 $11.39 $2.45 $14.67 $3.10 $18.61 $3.83 $22.99 Free Cash Flow $20.39 $32.26 $40.80 $52.58 $66.67 $84.46 Author estima Page 6 UV6569 Exhibit 2 OutReach Networks: First Venture Round Comparable Company Valuation Data (dollars in millions) Total Debt/ Capital % Beta Company Name (Ticker) Acme Packet, Inc. (APKT) Aruba Networks, Inc. (ARUN) Aviat Networks, Inc. (AVNW) Cisco Systems (CSCO) Market Capitalization $2,244 $2,258 $108 $100,206 Revenue $295 $433 $463 $43,724 Revenues, 1Yr Growth % 45.6% 48.2% 3.9% EBITDA Margin % 30.1% 3.0% 0.2% 25.3% TEV/ Forward EBITDA 13.7% 13.3x 4.2x 6.4x Forward P/E 24.3x 31.5% 21.3x 10.3% 1.50 1.95 1.35 1.20 7.6% 26.3% 4.7% Mean Median $26,204 $2,251 $11,229 $448 25.6% 25.2% 14.6% 14.1% 17.0% 17.0% 9.4x 9.9x 21.8% 22.8x 1.50 1.43 Notes: Valuation multiples as of November 2011. The 10-year U.S Treasury rate was assumed to be 5% and the market risk premium 6.0%. Company Descriptions: Acme Packet provided session delivery network solutions that enabled the delivery of voice, video, data, and unified communications services and applications across Internet protocol (IP) networks. Aruba Networks, incorporated in 2002, was a provider of next-generation network access solutions for the mobile enterprise. Its products unified wired and wireless network infrastructures into one seamless access solution for corporate headquarters, mobile business professionals, and remote workers. Aviat Networks designed, manufactured, and sold wireless networking products, solutions, and services in North America and internationally. It offered point-to-point digital microwave transmission systems for first- and last-mile access, middle mile/backhaul, and long-distance trunking applications. It also provided broadband wireless access base stations and customer premises equipment. Cisco Systems designed, manufactured, and sold IP-based networking and other products related to the communications and IT industry worldwide. It offered routers that interconnected public and private IP networks for mobile, data, voice, and video applications, and switching products, which provided connectivity to end users, workstations, IP phones, access points, and servers. Data source: CapitalStep by Step Solution
There are 3 Steps involved in it
Step: 1

Get Instant Access to Expert-Tailored Solutions
See step-by-step solutions with expert insights and AI powered tools for academic success
Step: 2

Step: 3
Ace Your Homework with AI
Get the answers you need in no time with our AI-driven, step-by-step assistance
Get Started
The World Is Your Oyster The Guide To Finding Great Investments Around The Globe
Authors: Jeff D. Opdyke
1st Edition
0307381048, 978-0307381040