Answered step by step
Verified Expert Solution
Question
1 Approved Answer
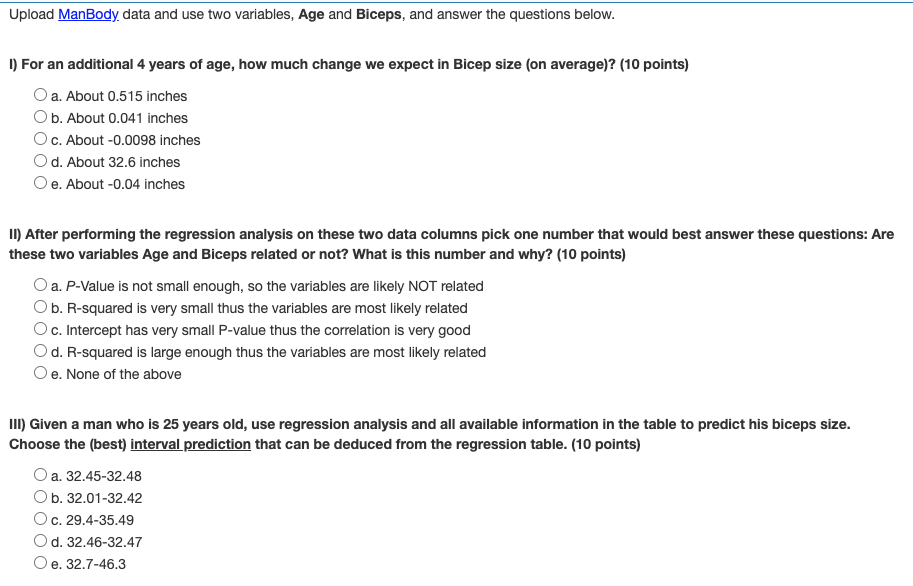
Upload ManBody, data and use two variables, Age and Biceps, and answer the questions below. 1) For an additional 4 years of age, how

Upload ManBody, data and use two variables, Age and Biceps, and answer the questions below. 1) For an additional 4 years of age, how much change we expect in Bicep size (on average)? (10 points) a. About 0.515 inches b. About 0.041 inches O c. About -0.0098 inches Od. About 32.6 inches e. About -0.04 inches II) After performing the regression analysis on these two data columns pick one number that would best answer these questions: Are these two variables Age and Biceps related or not? What is this number and why? (10 points) a. P-Value is not small enough, so the variables are likely NOT related b. R-squared is very small thus the variables are most likely related Oc. Intercept has very small P-value thus the correlation is very good d. R-squared is large enough thus the variables are most likely related e. None of the above III) Given a man who is 25 years old, use regression analysis and all available information in the table to predict his biceps size. Choose the (best) interval prediction that can be deduced from the regression table. (10 points) a. 32.45-32.48 b. 32.01-32.42 O c. 29.4-35.49 d. 32.46-32.47 e. 32.7-46.3
Step by Step Solution
★★★★★
3.38 Rating (145 Votes )
There are 3 Steps involved in it
Step: 1
is change iD PENDAY wo expect in bisep size when A4 000 98684x y321163583 change 0009...
Get Instant Access to Expert-Tailored Solutions
See step-by-step solutions with expert insights and AI powered tools for academic success
Step: 2

Step: 3

Ace Your Homework with AI
Get the answers you need in no time with our AI-driven, step-by-step assistance
Get Started


