

Answered step by step
Verified Expert Solution
Question
1 Approved Answer
U.S. companies have been carrying more cash ever since the global financial crisis of 2008. According to recent Flow of Funds estimates, U.S. non-financial corporations
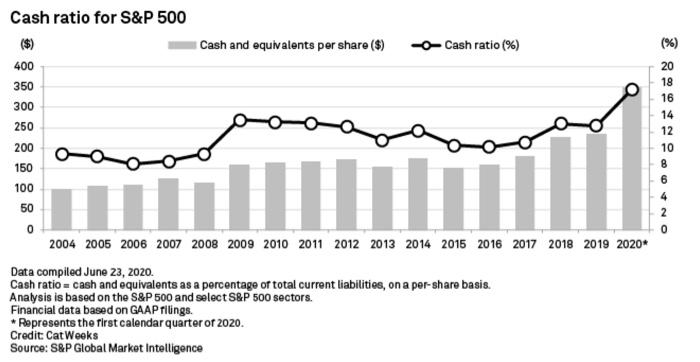
U.S. companies have been carrying more cash ever since the global financial crisis of 2008. According to recent Flow of Funds estimates, U.S. non-financial corporations are sitting on an aggregate cash and marketable securities position of close to $4 trillion. Largest companies in the S&P 500 index, including communications services giant Alphabet (GOOGL), and technology stalwarts Apple (AAPL) and Microsoft (MSFT), each hold a lion's share of this cash stockpile. The cash stash of Canadian non-financial firms has been increasing as well.
There are many possible reasons for why companies arent spending more given their vast reserves, and we talked about those in class. We discussed that precautionary motives are an important factor in a firms decision to hold cash. However, precautionary motives only explain the cross-sectional variation in domestic cash. A majority of the rise in total cash and 85% of the rise in the cash held by multinational corporations (MNCs) is due to a rise in MNCs foreign cash. This rise in foreign cash is driven by tax factors. As foreign tax rates fell below U.S. rates, there has been an incentive not only to delay the repatriation of foreign income, but also to shift income into lower tax jurisdictions.
In this discussion I ask you to think about the long-term effects of this on company balance sheets as well as on the overall economy. Is there a danger for the economy from firms' decisions to hoard cash? Should governments intervene and incentivize companies to repatriate funds held overseas?
Step by Step Solution
There are 3 Steps involved in it
Step: 1

Get Instant Access to Expert-Tailored Solutions
See step-by-step solutions with expert insights and AI powered tools for academic success
Step: 2

Step: 3
Ace Your Homework with AI
Get the answers you need in no time with our AI-driven, step-by-step assistance
Get Started
Advances In Entrepreneurial Finance
Authors: Rassoul Yazdipour
2011th Edition
148998190X, 978-1489981905