

Answered step by step
Verified Expert Solution
Question
1 Approved Answer
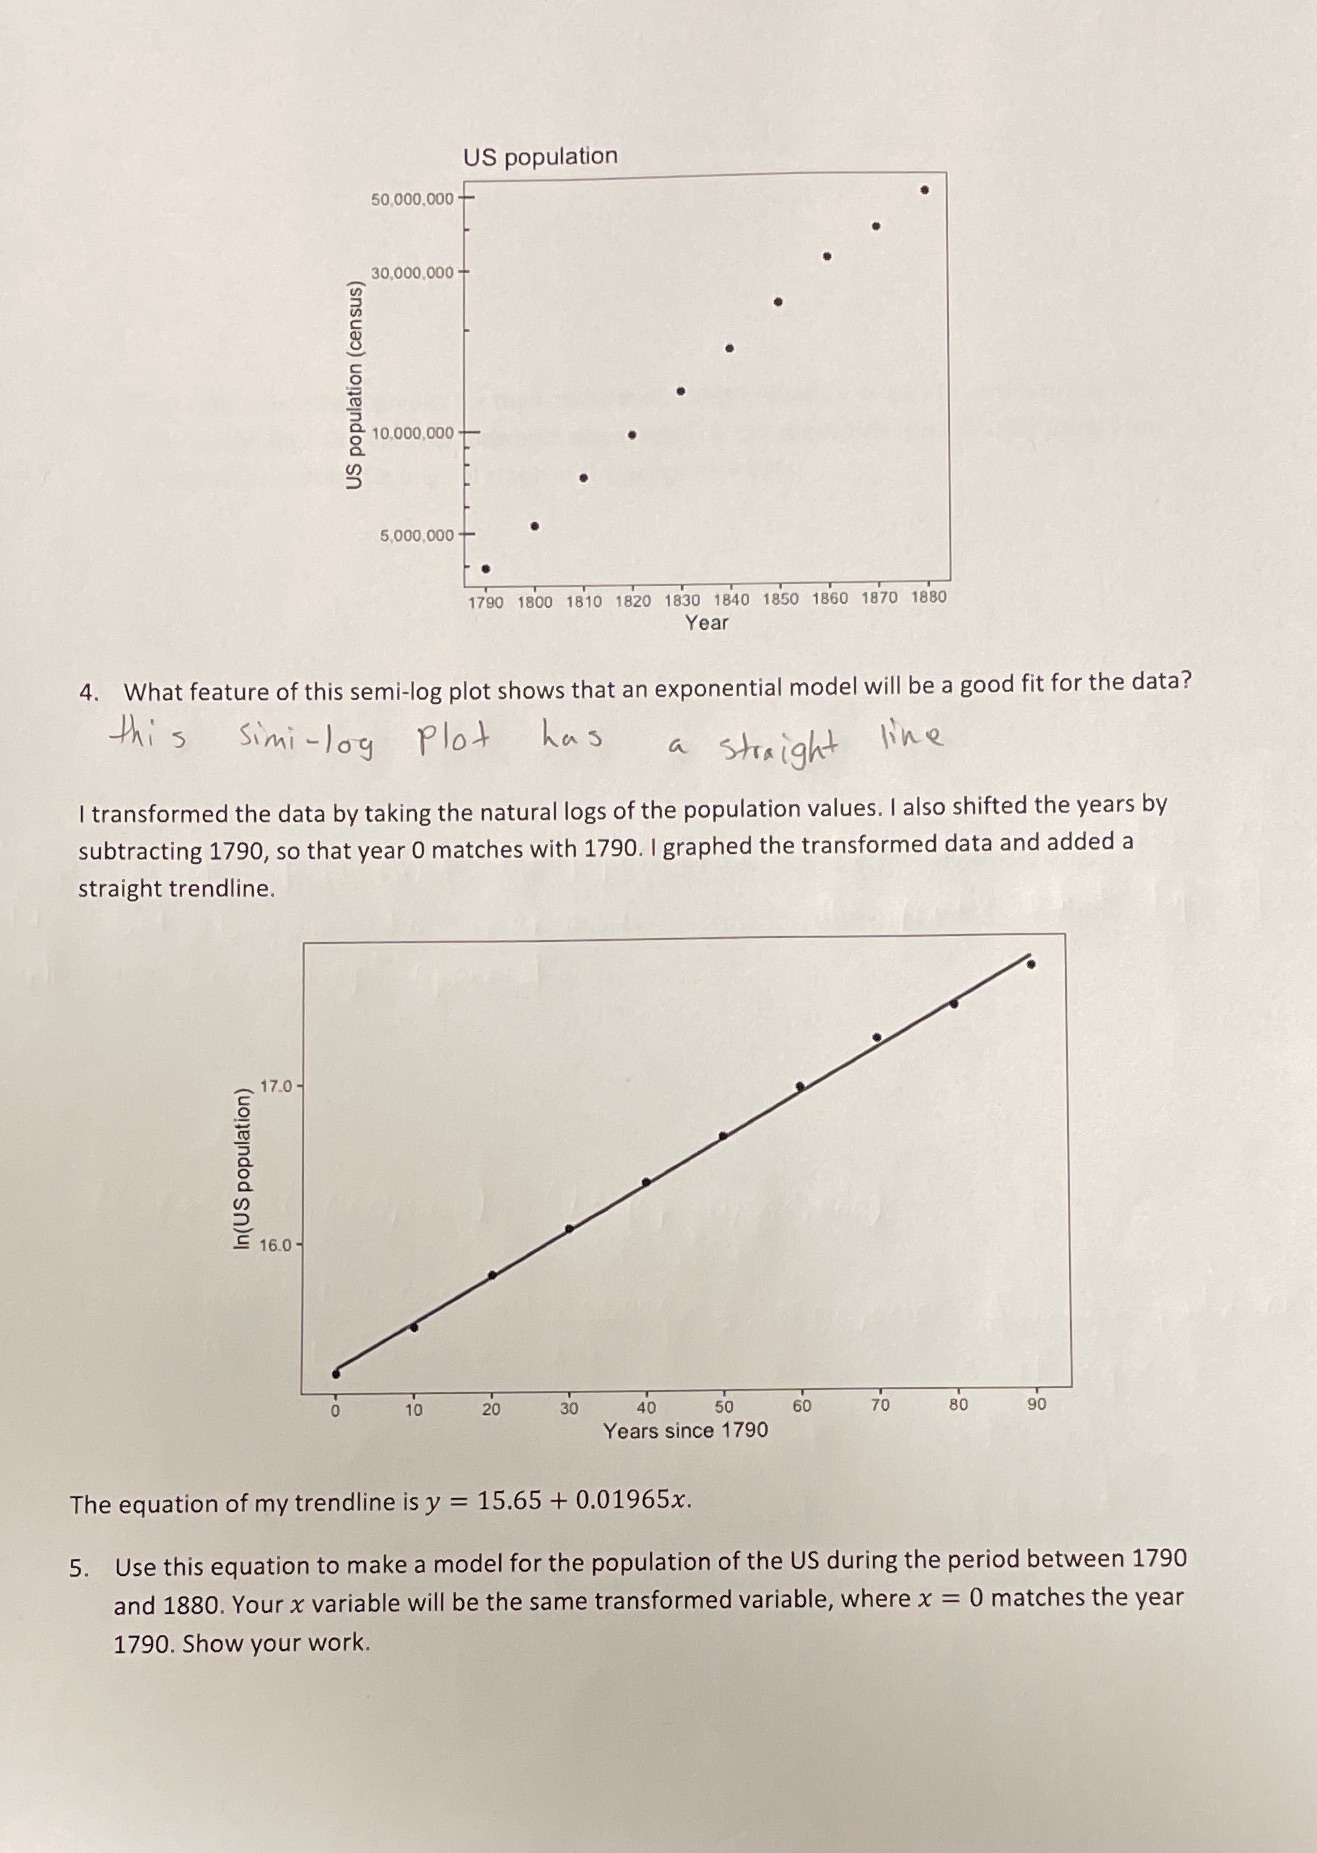
US population 50,000,000 - 30,000,000- US population (census) 10,000,000 5,000,000 - 1790 1800 1810 1820 1830 1840 1850 1860 1870 1880 Year 4. What feature

Step by Step Solution
There are 3 Steps involved in it
Step: 1

Get Instant Access to Expert-Tailored Solutions
See step-by-step solutions with expert insights and AI powered tools for academic success
Step: 2

Step: 3
Ace Your Homework with AI
Get the answers you need in no time with our AI-driven, step-by-step assistance
Get Started
Logic For Computer Science Foundations Of Automatic Theorem Proving
Authors: Jean H Gallier
1st Edition
0486805085, 9780486805085