

Answered step by step
Verified Expert Solution
Question
1 Approved Answer
Us Using the information above, explain in detail how the Failure Rate for the 36 signal flow is calculated. Show every step According to the
 Us
Us
Using the information above, explain in detail how the Failure Rate for the 36 signal flow is calculated. Show every step
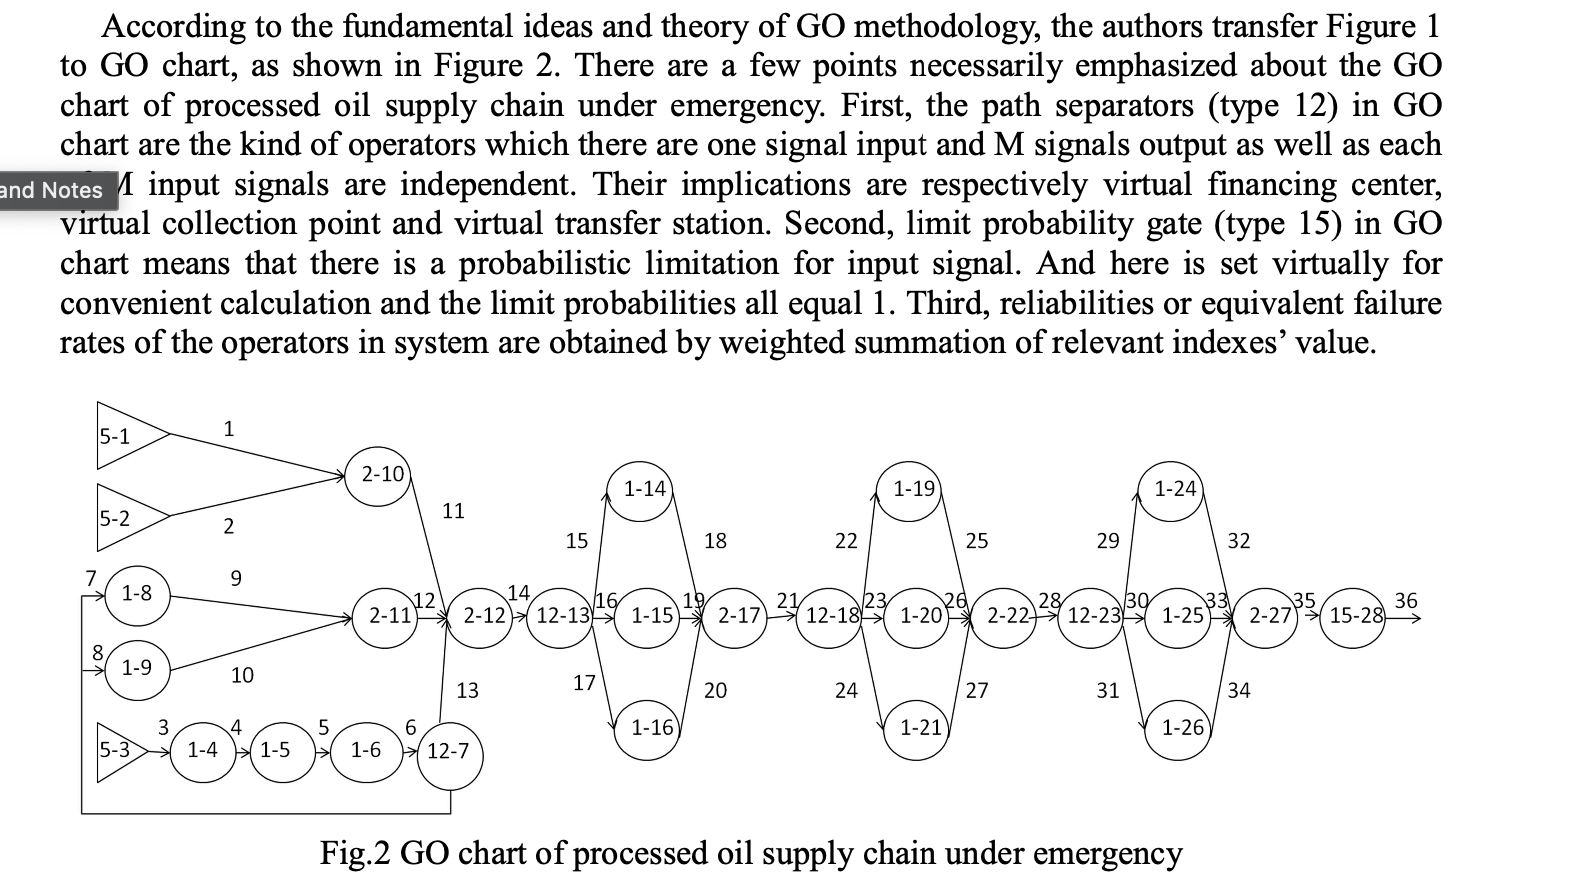
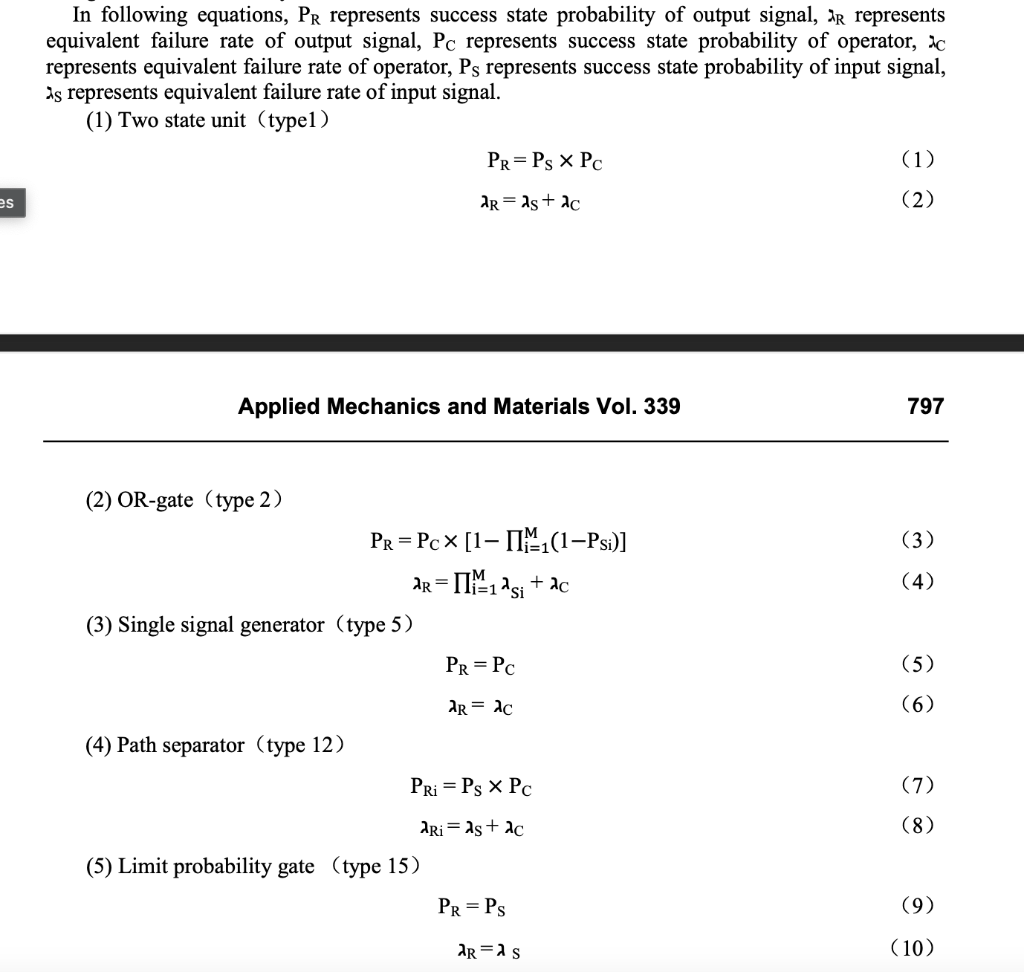
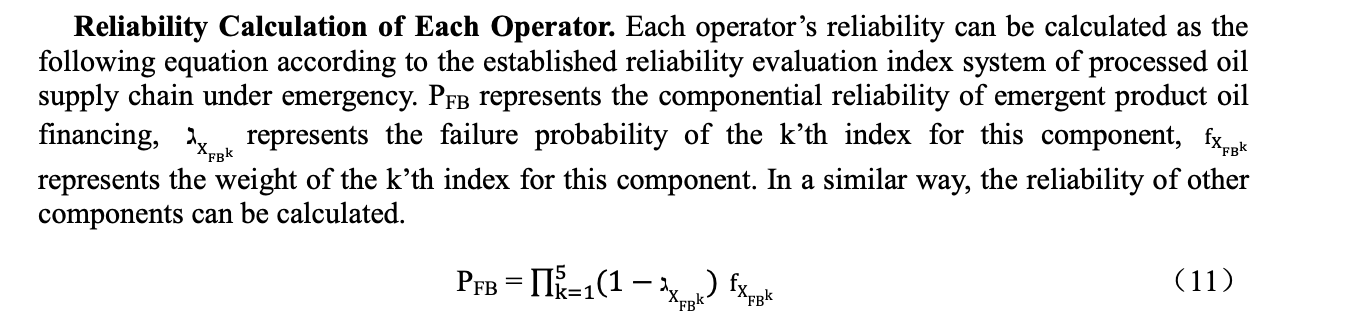
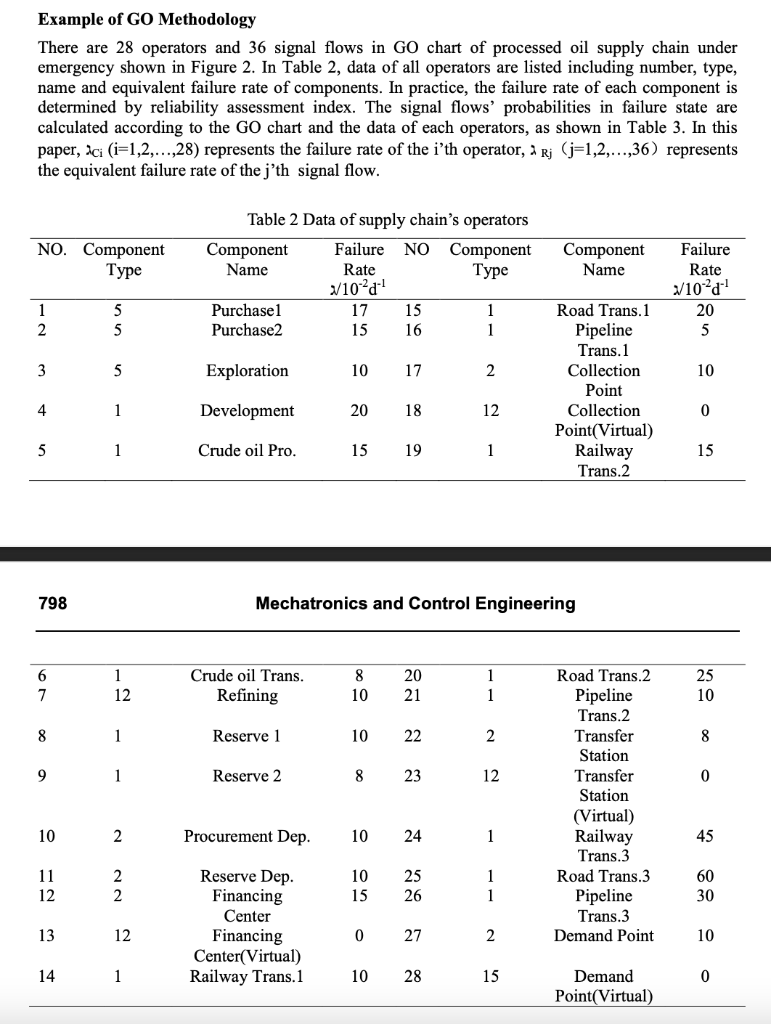
According to the fundamental ideas and theory of GO methodology, the authors transfer Figure 1 to GO chart, as shown in Figure 2. There are a few points necessarily emphasized about the GO chart of processed oil supply chain under emergency. First, the path separators (type 12) in GO chart are the kind of operators which there are one signal input and M signals output as well as each and Notes 1 input signals are independent. Their implications are respectively virtual financing center, virtual collection point and virtual transfer station. Second, limit probability gate (type 15) in GO chart means that there is a probabilistic limitation for input signal. And here is set virtually for convenient calculation and the limit probabilities all equal 1. Third, reliabilities or equivalent failure rates of the operators in system are obtained by weighted summation of relevant indexes value. 5-1 1 2-10 1-14 1-19 1-24 5-2 11 2 15 18 22 25 29 32 9 1-8 12 2-11 14 16 19 2-12 12-131-15 2-17 21 123 26 12-18-1-20 28 30 33 2-22-12-23 1-25 35 36 2-27 *( 15-28 1-9 10 13 17 20 24 27 31 34 1-16 1-21 1-26 5-3 4 1-4 (1-5 1-6 12-7 Fig.2 GO chart of processed oil supply chain under emergency In following equations, Pr represents success state probability of output signal, r represents equivalent failure rate of output signal, Pc represents success state probability of operator, 20 represents equivalent failure rate of operator, Ps represents success state probability of input signal, as represents equivalent failure rate of input signal. (1) Two state unit (typel) Pr=Ps x Pc (1) es Ar = 4s + c (2) Applied Mechanics and Materials Vol. 339 797 (3) (2) OR-gate (type 2) Pr = Pc* [1141(1Psi)] ar = 1141 2si + ac (3) Single signal generator (type 5) Pr = Pc (4) (5) Ar = dc (6) (4) Path separator (type 12) Pri = Ps X PC (7) Ari = 1s + Ac (8) (5) Limit probability gate (type 15) Pr = Ps (9) ar=as (10) Reliability Calculation of Each Operator. Each operator's reliability can be calculated as the following equation according to the established reliability evaluation index system of processed oil supply chain under emergency. Pfb represents the componential reliability of emergent product oil financing, dkpak represents the failure probability of the kth index for this component, fxrigk represents the weight of the kth index for this component. In a similar way, the reliability of other components can be calculated. PfB = Tk=1(1 4 x) k) Expk (11) Example of GO Methodology There are 28 operators and 36 signal flows in GO chart of processed oil supply chain under emergency shown in Figure 2. In Table 2, data of all operators are listed including number, type, name and equivalent failure rate of components. In practice, the failure rate of each component is determined by reliability assessment index. The signal flows' probabilities in failure state are calculated according to the GO chart and the data of each operators, as shown in Table 3. In this paper, aci (i=1,2,...,28) represents the failure rate of the i'th operator, a Rj (j=1,2,...,36) represents the equivalent failure rate of the j'th signal flow. NO. Component Type Table 2 Data of supply chain's operators Component Failure NO Component Name Rate Type V10-21 Purchasel 17 15 1 Purchase2 15 16 1 Component Name Failure Rate V10 20 5 1 2 5 5 3 5 Exploration 10 17 2 10 Road Trans. 1 Pipeline Trans. 1 Collection Point Collection Point(Virtual) Railway Trans.2 4 1 Development 20 18 12 0 5 1 Crude oil Pro. 15 19 1 15 798 Mechatronics and Control Engineering 6 7 1 12 Crude oil Trans. Refining 8 10 20 21 1 1 25 10 8 1 Reserve 1 10 22 2 8 9 1 Reserve 2 8 23 12 0 Road Trans.2 Pipeline Trans.2 Transfer Station Transfer Station (Virtual) Railway Trans.3 Road Trans. 3 Pipeline Trans.3 Demand Point 10 2 Procurement Dep. 10 24 1 45 11 12 2 2 10 15 25 26 1 1 60 30 Reserve Dep. Financing Center Financing Center(Virtual) Railway Trans.1 13 12 0 27 2. 10 14 1 10 28 15 0 Demand Point(Virtual) According to the fundamental ideas and theory of GO methodology, the authors transfer Figure 1 to GO chart, as shown in Figure 2. There are a few points necessarily emphasized about the GO chart of processed oil supply chain under emergency. First, the path separators (type 12) in GO chart are the kind of operators which there are one signal input and M signals output as well as each and Notes 1 input signals are independent. Their implications are respectively virtual financing center, virtual collection point and virtual transfer station. Second, limit probability gate (type 15) in GO chart means that there is a probabilistic limitation for input signal. And here is set virtually for convenient calculation and the limit probabilities all equal 1. Third, reliabilities or equivalent failure rates of the operators in system are obtained by weighted summation of relevant indexes value. 5-1 1 2-10 1-14 1-19 1-24 5-2 11 2 15 18 22 25 29 32 9 1-8 12 2-11 14 16 19 2-12 12-131-15 2-17 21 123 26 12-18-1-20 28 30 33 2-22-12-23 1-25 35 36 2-27 *( 15-28 1-9 10 13 17 20 24 27 31 34 1-16 1-21 1-26 5-3 4 1-4 (1-5 1-6 12-7 Fig.2 GO chart of processed oil supply chain under emergency In following equations, Pr represents success state probability of output signal, r represents equivalent failure rate of output signal, Pc represents success state probability of operator, 20 represents equivalent failure rate of operator, Ps represents success state probability of input signal, as represents equivalent failure rate of input signal. (1) Two state unit (typel) Pr=Ps x Pc (1) es Ar = 4s + c (2) Applied Mechanics and Materials Vol. 339 797 (3) (2) OR-gate (type 2) Pr = Pc* [1141(1Psi)] ar = 1141 2si + ac (3) Single signal generator (type 5) Pr = Pc (4) (5) Ar = dc (6) (4) Path separator (type 12) Pri = Ps X PC (7) Ari = 1s + Ac (8) (5) Limit probability gate (type 15) Pr = Ps (9) ar=as (10) Reliability Calculation of Each Operator. Each operator's reliability can be calculated as the following equation according to the established reliability evaluation index system of processed oil supply chain under emergency. Pfb represents the componential reliability of emergent product oil financing, dkpak represents the failure probability of the kth index for this component, fxrigk represents the weight of the kth index for this component. In a similar way, the reliability of other components can be calculated. PfB = Tk=1(1 4 x) k) Expk (11) Example of GO Methodology There are 28 operators and 36 signal flows in GO chart of processed oil supply chain under emergency shown in Figure 2. In Table 2, data of all operators are listed including number, type, name and equivalent failure rate of components. In practice, the failure rate of each component is determined by reliability assessment index. The signal flows' probabilities in failure state are calculated according to the GO chart and the data of each operators, as shown in Table 3. In this paper, aci (i=1,2,...,28) represents the failure rate of the i'th operator, a Rj (j=1,2,...,36) represents the equivalent failure rate of the j'th signal flow. NO. Component Type Table 2 Data of supply chain's operators Component Failure NO Component Name Rate Type V10-21 Purchasel 17 15 1 Purchase2 15 16 1 Component Name Failure Rate V10 20 5 1 2 5 5 3 5 Exploration 10 17 2 10 Road Trans. 1 Pipeline Trans. 1 Collection Point Collection Point(Virtual) Railway Trans.2 4 1 Development 20 18 12 0 5 1 Crude oil Pro. 15 19 1 15 798 Mechatronics and Control Engineering 6 7 1 12 Crude oil Trans. Refining 8 10 20 21 1 1 25 10 8 1 Reserve 1 10 22 2 8 9 1 Reserve 2 8 23 12 0 Road Trans.2 Pipeline Trans.2 Transfer Station Transfer Station (Virtual) Railway Trans.3 Road Trans. 3 Pipeline Trans.3 Demand Point 10 2 Procurement Dep. 10 24 1 45 11 12 2 2 10 15 25 26 1 1 60 30 Reserve Dep. Financing Center Financing Center(Virtual) Railway Trans.1 13 12 0 27 2. 10 14 1 10 28 15 0 Demand Point(Virtual)Step by Step Solution
There are 3 Steps involved in it
Step: 1

Get Instant Access to Expert-Tailored Solutions
See step-by-step solutions with expert insights and AI powered tools for academic success
Step: 2

Step: 3
Ace Your Homework with AI
Get the answers you need in no time with our AI-driven, step-by-step assistance
Get Started
Audit Effectiveness Meeting The IT Challenge
Authors: Kamil Omoteso
1st Edition
1409434680, 9781409434689