Answered step by step
Verified Expert Solution
Link Copied!

Question

1 Approved Answer

Use a statistical software package to complete the analysis of Exploratory Data Analysis and Inferential Statistics . You are strongly encouraged to use StatCrunch (in

image text in transcribedimage text in transcribed
  • Use a statistical software package to complete the analysis of Exploratory Data Analysis and Inferential Statistics. You are strongly encouraged to use StatCrunch (in MyLab Statistics). You may also use any other software packages (s.a. MINITAB, or SPSS). However, if you use other software, you are on your own, for your instructor will only help with question with regards to StatCrunch.
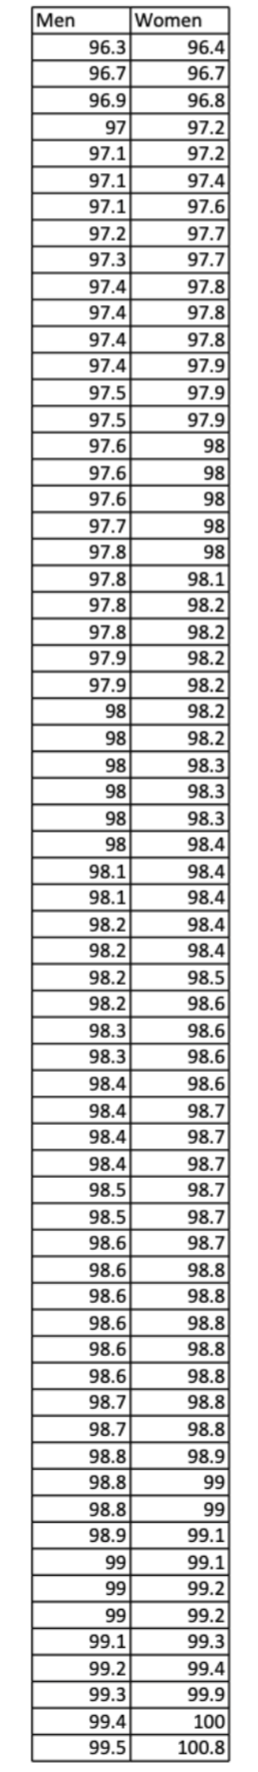
  • PLEASE COMPLETE ALL OF THE WORK USING ONLY THE "WOMEN" DATA SET

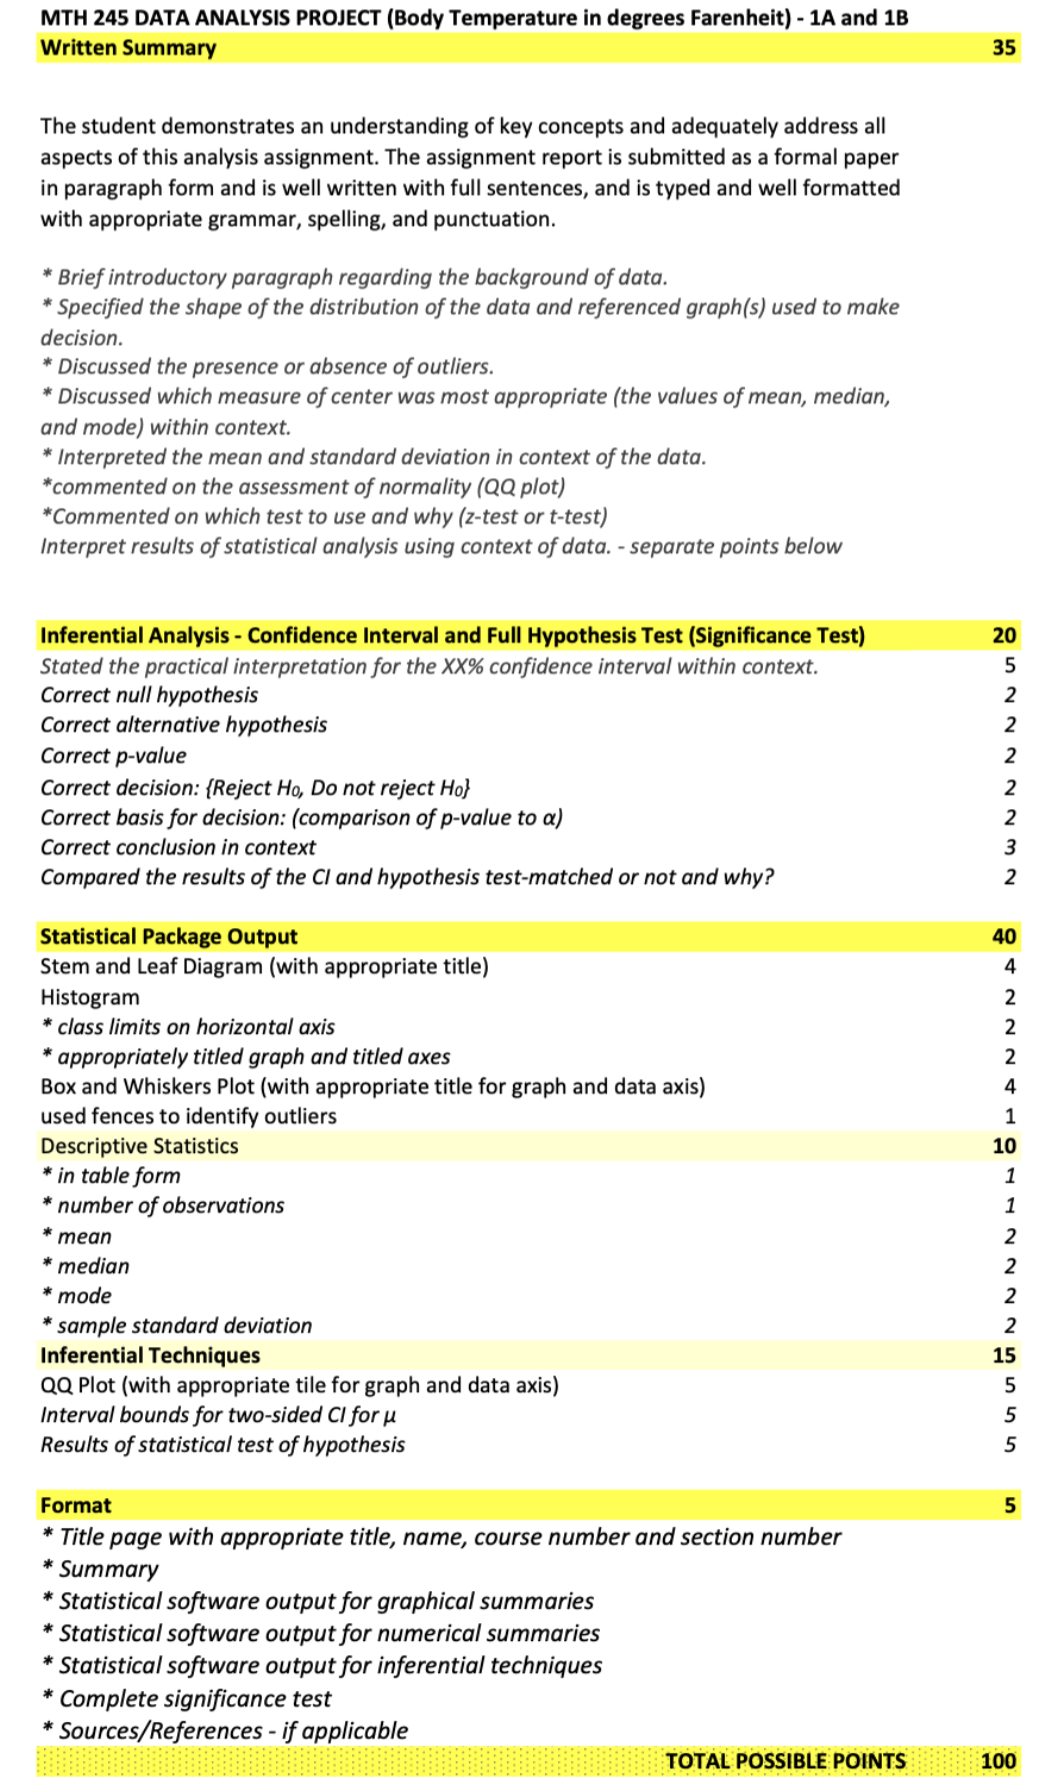
A) Exploratory Data Analysis

  1. Construct a stem and leaf display.
  2. Construct a histogram.
  3. Construct a boxplot and use it to investigate the data for outliers.
  4. Obtain the sample mean, median, mode, and standard deviation.

B) Inferential Statistics

  1. Construct a normal probability plot or quantile-quantile (QQ) plotto assess normality. Use this assessment to determine which tests are appropriate for these data for confidence interval and test of hypothesis as you will use these procedures for parts 2 and 3 below.
  2. Construct a 95% confidence interval for , for mean body temperature for all adult females in the population.
  3. At the 5% significance level, do the data provide sufficient evidence to conclude that the mean body temperature of women is 98.6F?
  4. Using the software output, perform the confidence interval and the full hypothesis test.
  • Write a summary and findings of the project

C) Write-up

  • Write a brief introduction of the project.
  • Interpret the mean, and standard deviation in context of the data given.
  • Compare the measures of center and comment on which measure of center would best describe the data given.
  • Comment on the shape of the distribution.
  • Are there any outliers in the data? Include results of your investigation for outliers.
  • Comment on your assessment of normality.
  • Which test will be most appropriate for the inferential statistics? Z-test or t-test? Why?
  • Write an interpretation for the confidence interval estimate in context of the data.
  • State the hypothesis (the null and the alternative)
  • State the conclusion and summary of the significance test and interpret the p-value using the context of the data.
  • Compare the results from the confidence interval and the significance test. Are they the same? Why do think this is the case?

  • Submit your project as an attachment via the link above using the following format in a Microsoft Word or pdf document
    • First page - Write - up (See Part C)
    • Final pages - Statistical Software Output and Additional Work (See Parts A and B)

Note:

  1. You must use complete sentences and correct grammar/spelling.
  2. Title and Label all of the graphs obtained.

THE DATA SHEET (DO ALL THE WORK WITH THE "WOMEN" DATA SET) :

image text in transcribedimage text in transcribed
Men Women 96.3 96.4 96.7 96.7 96.9 96.8 97 97.2 97.1 97.2 97.1 97.4 97.1 97.6 97.2 97.7 97.3 97.7 97.4 97.8 97.4 97.8 97.4 97.8 97.4 97.9 97.5 97.9 97.5 97.9 97.6 98 97.6 98 97.6 98 97.7 98 97.8 98 97.8 98.1 97.8 98.2 97.8 98.2 97.9 98.2 97.9 98.2 98 98.2 98 98.2 98 98.3 98 98.3 98 98.3 98 98.4 98.1 98.4 98.1 98.4 98.2 98.4 98.2 98.4 98.2 98.5 98.2 98.6 98.3 98.6 98.3 98.6 98.4 98.6 98.4 98.7 98.4 98.7 98.4 98.7 98.5 98.7 98.5 98.7 98.6 98.7 98.6 98.8 98.6 98.8 98.6 98.8 98.6 98.8 98.6 98.8 98.7 98.8 98.7 98.8 98.8 98.9 98.8 99 98.8 99 98.9 99.1 99 99.1 99 99.2 99 99.2 99.1 99.3 99.2 99.4 99.3 99.9 99.4 100 99.5 100.8MTi-I 245 DATA ANALYSIS PROJECT (Body Temperature In degrees Farenhelt) - 1A and 13 Written Summary The student demonstrates an understanding of key concepts and adequately address all aspects of this analysis assignment. The assignment report is submitted as a formal paper in paragraph form and is well written with full sentences, and is typed and well formatted with appropriate grammar, spelling, and punctuation. "' Brief introductory paragraph regarding the background of data. " Specied the shape of the distribution of the data and referenced graph{s) used to moire decision. ' Discussed the presence or absence of outliers. ' Discussed which measure of center was most appropriate (the values of mean, median, and mode) within context. " interpreted the mean and standard deviation in context of the data. 'commented on the assessment of normality (Q0 plot) "Commented on which test to use and why (z-test or t-test) interpret results of statistical analysis using context of data. - separate points below Interentlal Analysis - Confidence Interval and Pa! Hypothesis Test (Signicance Test) Stated the practical interpretation for the XX% confidence interval within context. Correct null hypothesis Correct alternative hypothesis Correct p-value Correct decision: {Reject Hq. Do not reject Ha} Correct basis for decision: (comparison of p-value to a) Correct conclusion in context Compared the results of the Cl and hypothesis test-matched or not and why? Statistical Package Output Stem and Leaf Diagram (with appropriate title) Histogram " class limits on horizontal axis ' appropriately titled graph and titled axes Box and Whiskers Plot (with appropriate title for graph and data axis) used fences to identify outliers Descriptive Statistics ' in tablefom'i " number of observations " mean "' median " mode ' sample standard deviation Inferentlal Techniques QQ Plot (with appropriate tile for graph and data axis) interval be an ds for two-sided Ci for a Results of statistical test of hypothesis Format " Title page with appropriate title, name, course number and section number "' Summary "' Statistical software output for graphical summaries \" Statistical software output for numerical summaries * Statistical software output for inferential techniques "' Complete significance test "' Sources/References - if applicable MWNNNNNU'IE H NNNNHHOthnw-hs H In U'IU'IU'I

Step by Step Solution

There are 3 Steps involved in it

Step: 1

blur-text-image

Get Instant Access to Expert-Tailored Solutions

See step-by-step solutions with expert insights and AI powered tools for academic success

Step: 2

blur-text-image

Step: 3

blur-text-image

Ace Your Homework with AI

Get the answers you need in no time with our AI-driven, step-by-step assistance

Get Started

Recommended Textbook for

Entropy And Diversity The Axiomatic Approach

Authors: Tom Leinster

1st Edition

1108962173, 9781108962179

More Books

Students also viewed these Mathematics questions

Question

Explain the process of Human Resource Planning.

Answered: 1 week ago

Question

4. Similarity (representativeness).

Answered: 1 week ago