Answered step by step
Verified Expert Solution
Question
1 Approved Answer
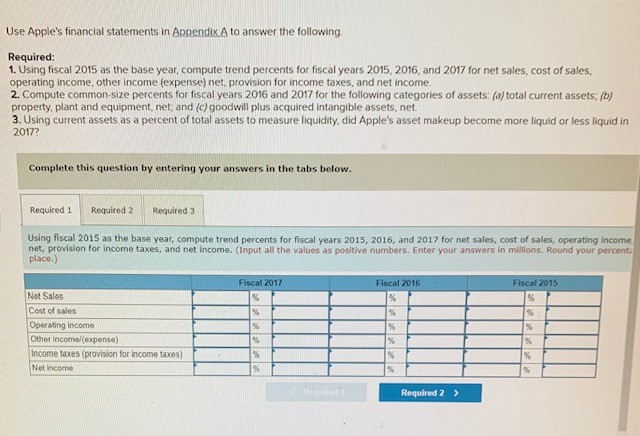
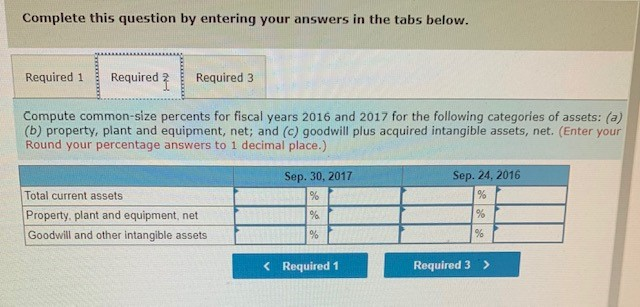
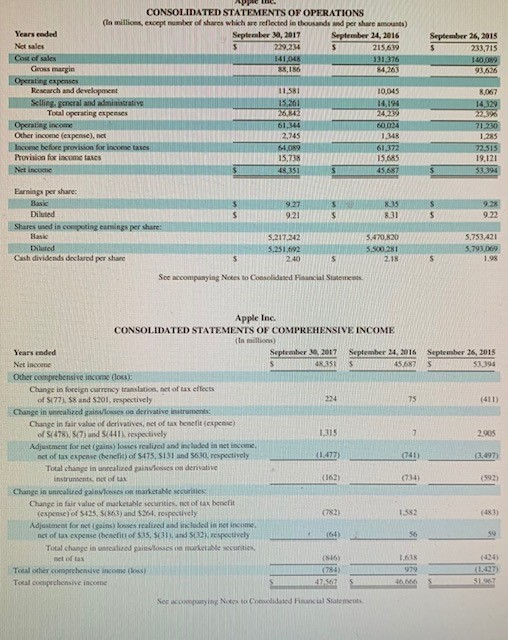
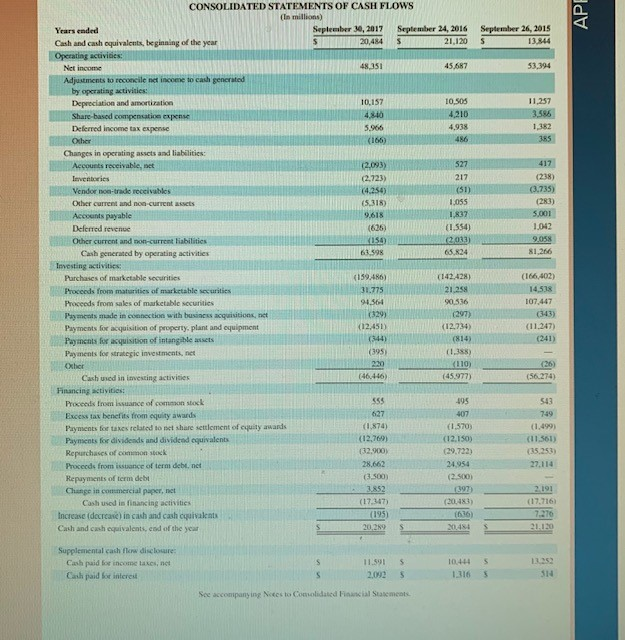
Use Apple's financial statements in Appendix A to answer the following. Required: 1. Using fiscal 2015 as the base year, compute trend percents for fiscal
Step by Step Solution
There are 3 Steps involved in it
Step: 1

Get Instant Access to Expert-Tailored Solutions
See step-by-step solutions with expert insights and AI powered tools for academic success
Step: 2

Step: 3
Ace Your Homework with AI
Get the answers you need in no time with our AI-driven, step-by-step assistance
Get Started