Answered step by step
Verified Expert Solution
Question
1 Approved Answer
Use appropriate (applicable) methods of descriptive statistics, including tables and plots, to summarize the data (depending on the data type quantitative continuous or discrete


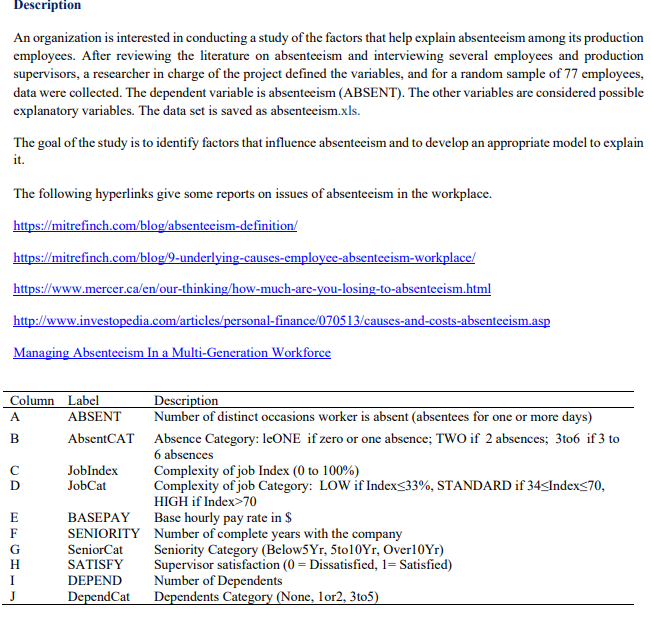
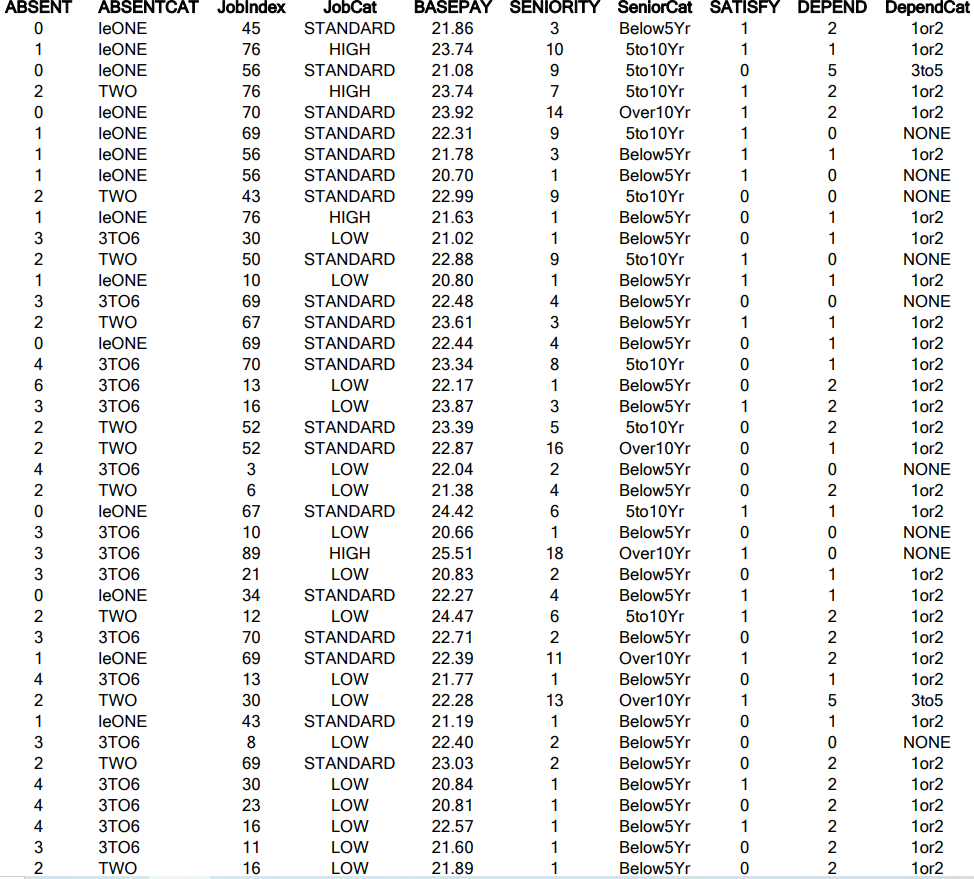
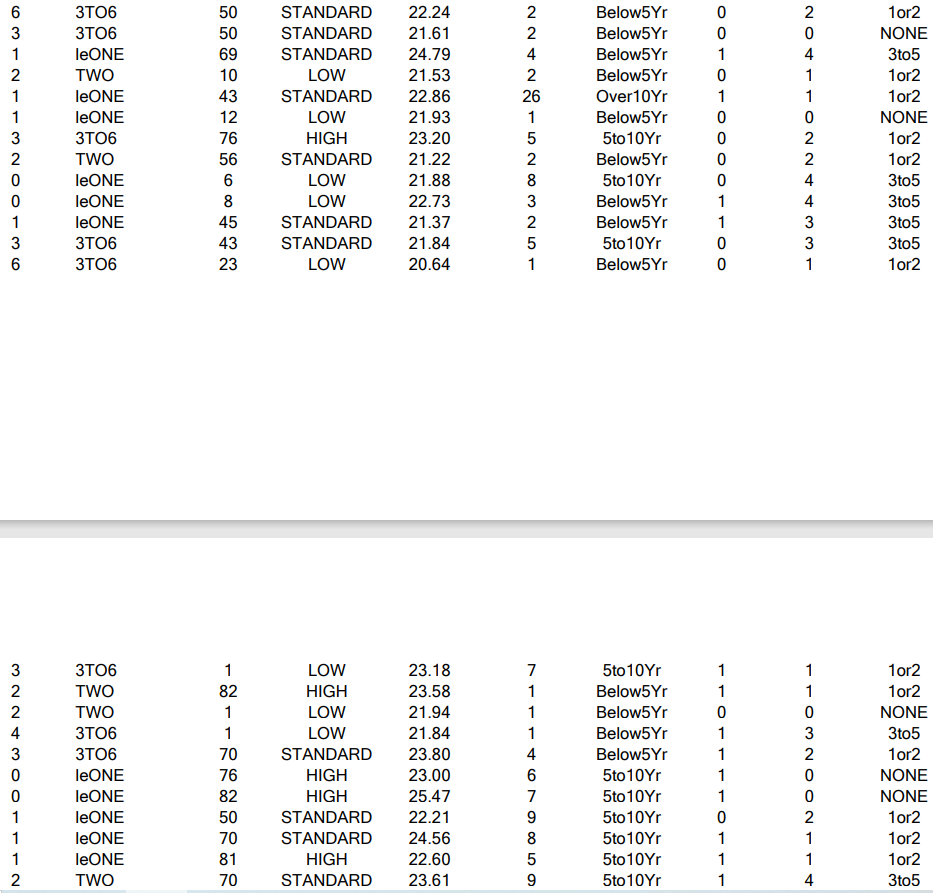
Use appropriate (applicable) methods of descriptive statistics, including tables and plots, to summarize the data (depending on the data type quantitative continuous or discrete and qualitative or categorical). That is, prepare appropriate tables of descriptive statistics (mean, standard deviation, coefficient of variation, quartiles, IQR, correlations) and appropriate plots (histograms, dotplots, bar/pie charts, stem plots, boxplots, scatterplots) of the variables, overall and when appropriate, by categories. You are expected to produce displays that will allow you to describe the distribution in terms of symmetry, dispersion, and outlying observations. Present the summaries of statistical results that will be beneficial in communicating the results to others. Description An organization is interested in conducting a study of the factors that help explain absenteeism among its production employees. After reviewing the literature on absenteeism and interviewing several employees and production supervisors, a researcher in charge of the project defined the variables, and for a random sample of 77 employees, data were collected. The dependent variable is absenteeism (ABSENT). The other variables are considered possible explanatory variables. The data set is saved as absenteeism.xls. The goal of the study is to identify factors that influence absenteeism and to develop an appropriate model to explain it. The following hyperlinks give some reports on issues of absenteeism in the workplace. https://mitrefinch.com/blog/absenteeism-definition/ https://mitrefinch.com/blog/9-underlying-causes-employee-absenteeism-workplace/ https://www.mercer.ca/en/our-thinking/how-much-are-you-losing-to-absenteeism.html http://www.investopedia.com/articles/personal-finance/070513/causes-and-costs-absenteeism.asp Managing Absenteeism In a Multi-Generation Workforce ABSENT Column Label AB A AbsentCAT CA JobIndex JobCat BEGHT) BASEPAY F SENIORITY SeniorCat SATISFY DEPEND DependCat Description Number of distinct occasions worker is absent (absentees for one or more days) Absence Category: leONE if zero or one absence; TWO if 2 absences; 3t06 if 3 to 6 absences Complexity of job Index (0 to 100%) Complexity of job Category: LOW if Index33%, STANDARD if 34 70 Base hourly pay rate in $ Number of complete years with the company Seniority Category (Below5Yr, 5to10Yr, Over10Yr) Supervisor satisfaction (0 = Dissatisfied, 1= Satisfied) Number of Dependents Dependents Category (None, 1or2, 3to5) ABSENT ABSENTCAT Jobindex 0 leONE 45 JobCat STANDARD BASEPAY SENIORITY SeniorCat SATISFY DEPEND DependCat 21.86 3 Below5Yr 1 2 1or2 1 leONE 76 HIGH 23.74 10 5to10Yr 1 1 1or2 0 leONE 56 STANDARD 21.08 9 5to10Yr 0 5 3to5 2 TWO 76 HIGH 23.74 7 5to10Yr 1 2 1or2 0 leONE 70 STANDARD 23.92 14 Over10Yr 1 2 1or2 1 leONE 69 STANDARD 22.31 9 5to10Yr 1 0 NONE 1 leONE 56 STANDARD 21.78 3 Below5Yr 1 1 1or2 1 leONE 56 STANDARD 20.70 1 Below5Yr 1 0 NONE 2 TWO 43 STANDARD 22.99 9 5to10Yr 0 0 NONE 1 leONE 76 HIGH 21.63 1 Below5Yr 0 1 1or2 3 3T06 30 LOW 21.02 1 Below5Yr 0 1 1or2 2 TWO 50 STANDARD 22.88 9 5to10Yr 1 0 NONE 1 leONE 10 LOW 20.80 1 Below5Yr 1 1or2 3 3T06 69 STANDARD 22.48 4 Below5Yr 0 0 NONE 2 TWO 67 STANDARD 23.61 3 Below5Yr 1 1 1or2 0 leONE 69 STANDARD 22.44 4 Below5Yr 0 1 1or2 4 3T06 70 STANDARD 23.34 8 5to10Yr 0 1 1or2 6 3T06 13 LOW 22.17 1 Below5Yr 0 2 1or2 3 3T06 2 TWO 2 TWO 4 3T06 2 TWO 0 leONE 3 3T06 3 3T06 3 3T06 0 leONE 2 TWO 3 3T06 1 leONE 4 3T06 2 TWO 1 leONE 3 3T06 2 TWO 4 3T06 4 3T06 4 3T06 3 3TO6 62230622ZZEROCO7883361 LOW 23.87 3 Below5Yr 1 2 1or2 52 STANDARD 23.39 5 5to10Yr 0 2 1or2 52 STANDARD 22.87 16 Over10Yr 0 1 1or2 LOW 22.04 2 Below5Yr 0 0 NONE LOW 21.38 4 Below5Yr 0 2 1or2 STANDARD 24.42 6 5to10Yr 1 1 1or2 LOW 20.66 1 Below5Yr 0 0 NONE 89 HIGH 25.51 18 Over10Yr 1 0 NONE LOW 20.83 2 Below5Yr 0 1 1or2 34 STANDARD 22.27 4 Below5Yr 1 1 1or2 LOW STANDARD 22.71 24.47 6 5to10Yr 1 2 1or2 2 Below5Yr 0 2 1or2 69 STANDARD 22.39 11 Over10Yr 1 2 1or2 LOW 21.77 1 Below5Yr 0 1 1or2 LOW 22.28 13 Over10Yr 1 5 3to5 43 STANDARD 21.19 1 Below5Yr 0 1 1or2 LOW 22.40 2 Below5Yr 0 0 NONE 69 STANDARD 23.03 2 Below5Yr 0 2 1or2 LOW 20.84 1 Below5Yr 1 2 1or2 LOW 20.81 1 Below5Yr 0 2 1or2 LOW 22.57 1 Below5Yr 1 2 1or2 11 LOW 21.60 1 Below5Yr 0 2 1or2 2 TWO 16 LOW 21.89 1 Below5Yr 0 2 1or2 6 3T06 50 STANDARD 22.24 3 3T06 50 STANDARD 21.61 1 leONE 69 STANDARD 24.79 2 TWO 10 LOW 21.53 1 leONE 43 STANDARD 22.86 22420 Below5Yr 0 Below5Yr 0 Below5Yr 1 204 1or2 NONE 3to5 Below5Yr 0 1 1or2 26 Over10Yr 1 1 1or2 1 leONE 12 LOW 21.93 1 Below5Yr 0 0 NONE 3 3T06 76 HIGH 23.20 5 5to10Yr 0 2 1or2 2 TWO 56 STANDARD 21.22 2 Below5Yr 0 0 leONE 6 LOW 21.88 8 5to10Yr 0 0 leONE 8 LOW 22.73 3 Below5Yr 1 1 leONE 45 36 3T06 3T06 23 422 STANDARD 21.37 43 STANDARD 21.84 LOW 25 Below5Yr 1 5 5to10Yr 0 20.64 1 Below5Yr 0 244331 1or2 3to5 3to5 3to5 3t05 1or2 32 3 3T06 2 TWO 18 LOW 23.18 7 5to10Yr 1 1 1or2 82 HIGH 23.58 1 Below5Yr 1 1 1or2 2 TWO 1 LOW 21.94 1 Below5Yr 0 0 NONE 4 3T06 1 LOW 21.84 1 Below5Yr 1 3 3t05 3 3T06 70 STANDARD 23.80 4 Below5Yr 1 2 1or2 0 leONE 76 HIGH 23.00 6 5to10Yr 1 0 NONE 0 leONE 82 HIGH 25.47 7 5to10Yr 1 1 leONE 50 STANDARD 22.21 9 5to10Yr 0 1 leONE 70 STANDARD 24.56 8 5to10Yr 1 1 leONE 81 HIGH 22.60 5 5to10Yr 1 2 TWO 70 STANDARD 23.61 9 5to10Yr 1 02114 NONE 1or2 1or2 1or2 3to5 32222 3T06 1 LOW 23.35 2 Below5Yr 1 TWO 8 LOW 21.51 1 Below5Yr 1 TWO 23 LOW 21.27 2 Below5Yr 1 323 3to5 1or2 3to5 TWO 21 LOW 21.67 12 Over10Yr 1 4 3to5 TWO 82 HIGH 24.54 7 5to10Yr 1 5 3to5 1 leONE 67 STANDARD 24.82 28 Over10Yr 1 3 3to5 0 leONE 81 HIGH 23.00 18 Over10Yr 1 2 1or2 1 leONE 43 STANDARD 23.50 6 5to10Yr 1 0 NONE 4 3T06 6 LOW 21.58 3 Below5Yr 0 1 1or2 3 3T06 13 LOW 23.44 8 5to10Yr 0 4 3to5 2 TWO 52 STANDARD 23.24 7 5to10Yr 0 1 1or2 3 3T06 52 STANDARD 21.26 1 Below5Yr 0 1 1or2
Step by Step Solution
There are 3 Steps involved in it
Step: 1

Get Instant Access to Expert-Tailored Solutions
See step-by-step solutions with expert insights and AI powered tools for academic success
Step: 2

Step: 3

Ace Your Homework with AI
Get the answers you need in no time with our AI-driven, step-by-step assistance
Get Started


