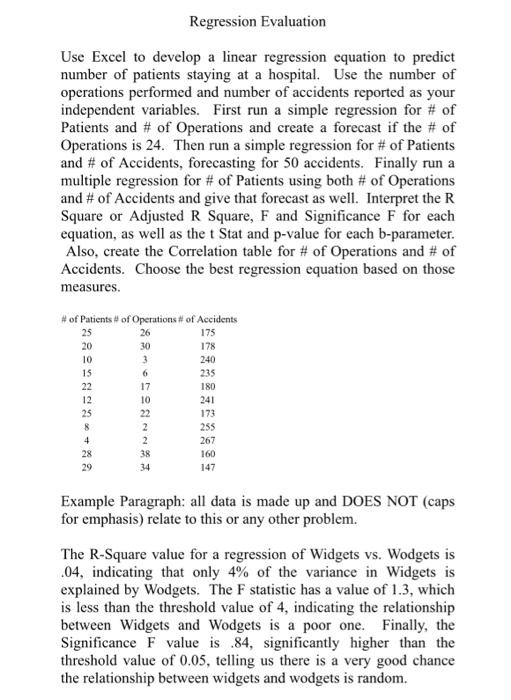
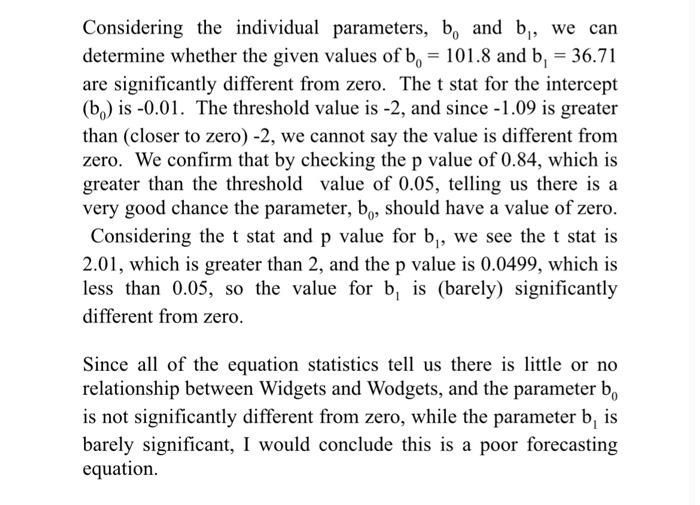
Use Excel to develop a linear regression equation to predict number of patients staying at a hospital. Use the number of operations performed and number of accidents reported as your independent variables. First run a simple regression for \# of Patients and \# of Operations and create a forecast if the \# of Operations is 24. Then run a simple regression for \# of Patients and \# of Accidents, forecasting for 50 accidents. Finally run a multiple regression for \# of Patients using both \# of Operations and \# of Accidents and give that forecast as well. Interpret the R Square or Adjusted R Square, F and Significance F for each equation, as well as the t Stat and p-value for each b-parameter. Also, create the Correlation table for \# of Operations and \# of Accidents. Choose the best regression equation based on those measures. Example Paragraph: all data is made up and DOES NOT (caps for emphasis) relate to this or any other problem. The R-Square value for a regression of Widgets vs. Wodgets is .04 , indicating that only 4% of the variance in Widgets is explained by Wodgets. The F statistic has a value of 1.3 , which is less than the threshold value of 4 , indicating the relationship between Widgets and Wodgets is a poor one. Finally, the Significance F value is .84 , significantly higher than the threshold value of 0.05 , telling us there is a very good chance the relationship between widgets and wodgets is random. Considering the individual parameters, b0 and b1, we can determine whether the given values of b0=101.8 and b1=36.71 are significantly different from zero. The t stat for the intercept (b0) is -0.01 . The threshold value is -2 , and since -1.09 is greater than (closer to zero) -2 , we cannot say the value is different from zero. We confirm that by checking the p value of 0.84 , which is greater than the threshold value of 0.05 , telling us there is a very good chance the parameter, b0, should have a value of zero. Considering the t stat and p value for b1, we see the t stat is 2.01 , which is greater than 2 , and the p value is 0.0499 , which is less than 0.05 , so the value for b1 is (barely) significantly different from zero. Since all of the equation statistics tell us there is little or no relationship between Widgets and Wodgets, and the parameter b0 is not significantly different from zero, while the parameter b1 is barely significant, I would conclude this is a poor forecasting equation. Use Excel to develop a linear regression equation to predict number of patients staying at a hospital. Use the number of operations performed and number of accidents reported as your independent variables. First run a simple regression for \# of Patients and \# of Operations and create a forecast if the \# of Operations is 24. Then run a simple regression for \# of Patients and \# of Accidents, forecasting for 50 accidents. Finally run a multiple regression for \# of Patients using both \# of Operations and \# of Accidents and give that forecast as well. Interpret the R Square or Adjusted R Square, F and Significance F for each equation, as well as the t Stat and p-value for each b-parameter. Also, create the Correlation table for \# of Operations and \# of Accidents. Choose the best regression equation based on those measures. Example Paragraph: all data is made up and DOES NOT (caps for emphasis) relate to this or any other problem. The R-Square value for a regression of Widgets vs. Wodgets is .04 , indicating that only 4% of the variance in Widgets is explained by Wodgets. The F statistic has a value of 1.3 , which is less than the threshold value of 4 , indicating the relationship between Widgets and Wodgets is a poor one. Finally, the Significance F value is .84 , significantly higher than the threshold value of 0.05 , telling us there is a very good chance the relationship between widgets and wodgets is random. Considering the individual parameters, b0 and b1, we can determine whether the given values of b0=101.8 and b1=36.71 are significantly different from zero. The t stat for the intercept (b0) is -0.01 . The threshold value is -2 , and since -1.09 is greater than (closer to zero) -2 , we cannot say the value is different from zero. We confirm that by checking the p value of 0.84 , which is greater than the threshold value of 0.05 , telling us there is a very good chance the parameter, b0, should have a value of zero. Considering the t stat and p value for b1, we see the t stat is 2.01 , which is greater than 2 , and the p value is 0.0499 , which is less than 0.05 , so the value for b1 is (barely) significantly different from zero. Since all of the equation statistics tell us there is little or no relationship between Widgets and Wodgets, and the parameter b0 is not significantly different from zero, while the parameter b1 is barely significant, I would conclude this is a poor forecasting equation


