

Question
Use Exhibit 10-1 to find the average number of additional years a male and female, age 75, are expected to live, based on the statistics
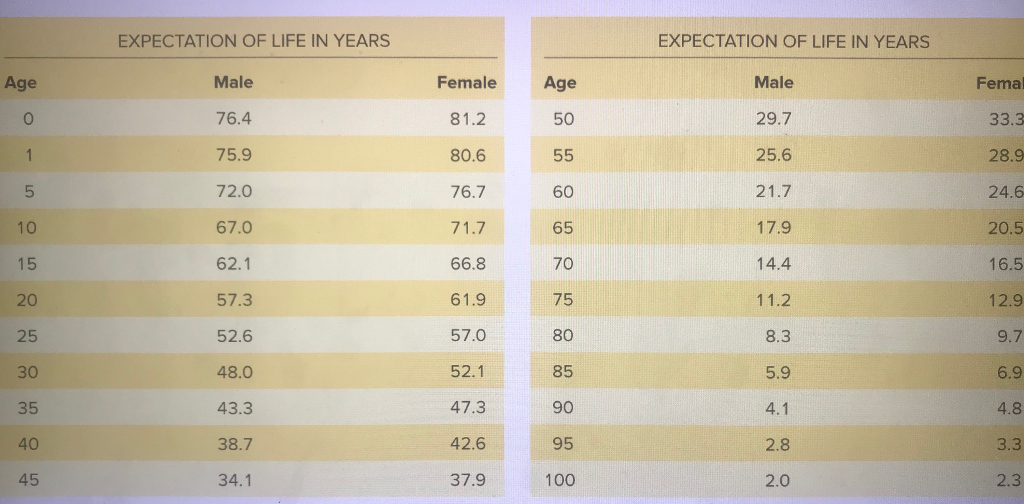
Use Exhibit 10-1 to find the average number of additional years a male and female, age 75, are expected to live, based on the statistics gathered by the U.S. government as of 2012. (Round your answers to 1 decimal place.)
Step by Step Solution
There are 3 Steps involved in it
Step: 1

Get Instant Access to Expert-Tailored Solutions
See step-by-step solutions with expert insights and AI powered tools for academic success
Step: 2

Step: 3
Ace Your Homework with AI
Get the answers you need in no time with our AI-driven, step-by-step assistance
Get Started
Grow Your Small Business Profits How I Find A 100K In Any Business In 45 Minutes
Authors: Sharon Coleman
1st Edition
B0C9S9CCZJ, 979-8850917258