Use exhibits 4 and 5 and the associated spreadsheet to prepare a cash flow forecast over the next 30 months (1 page plus excel file). Explain how you developed your forecast. (you can zoom in to see the values better or can also save the images) 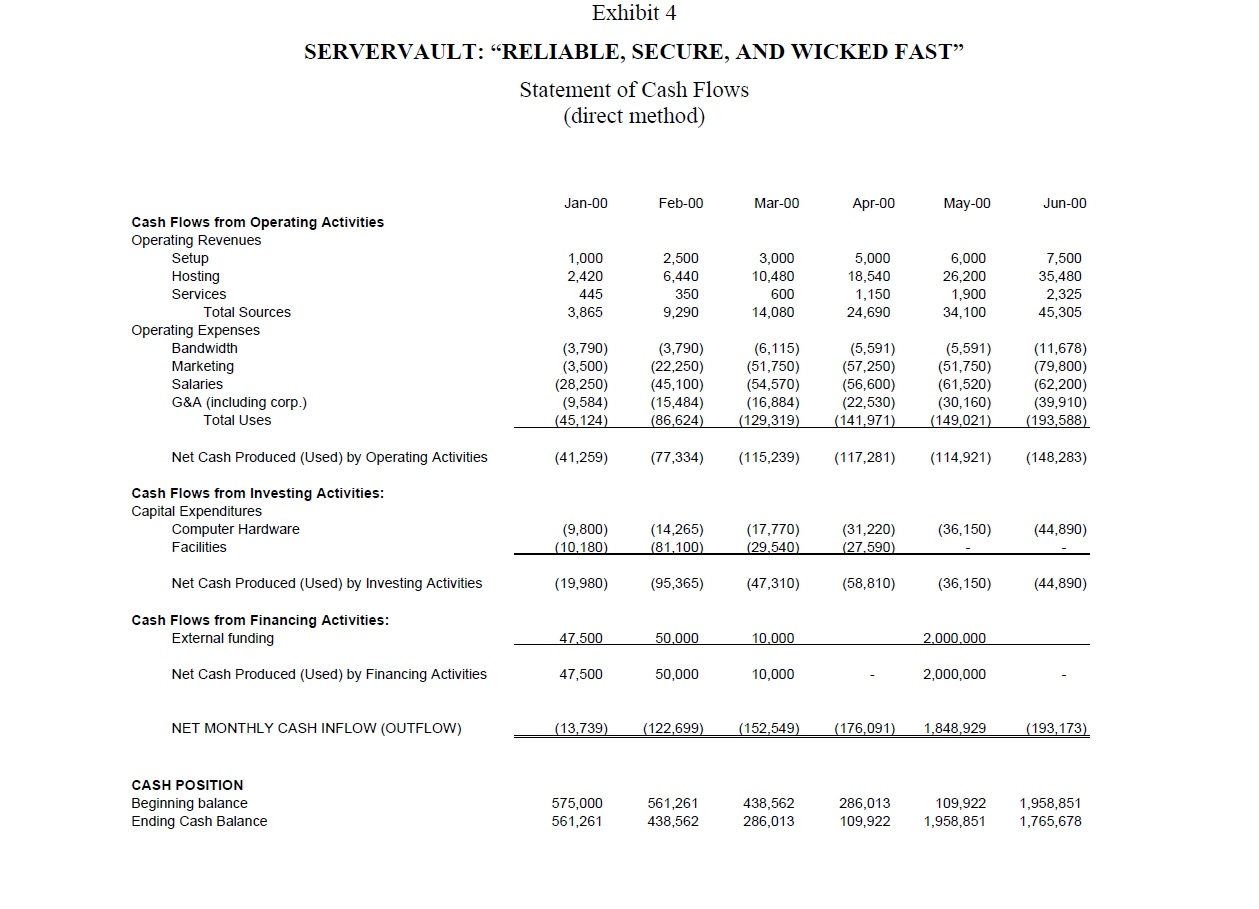
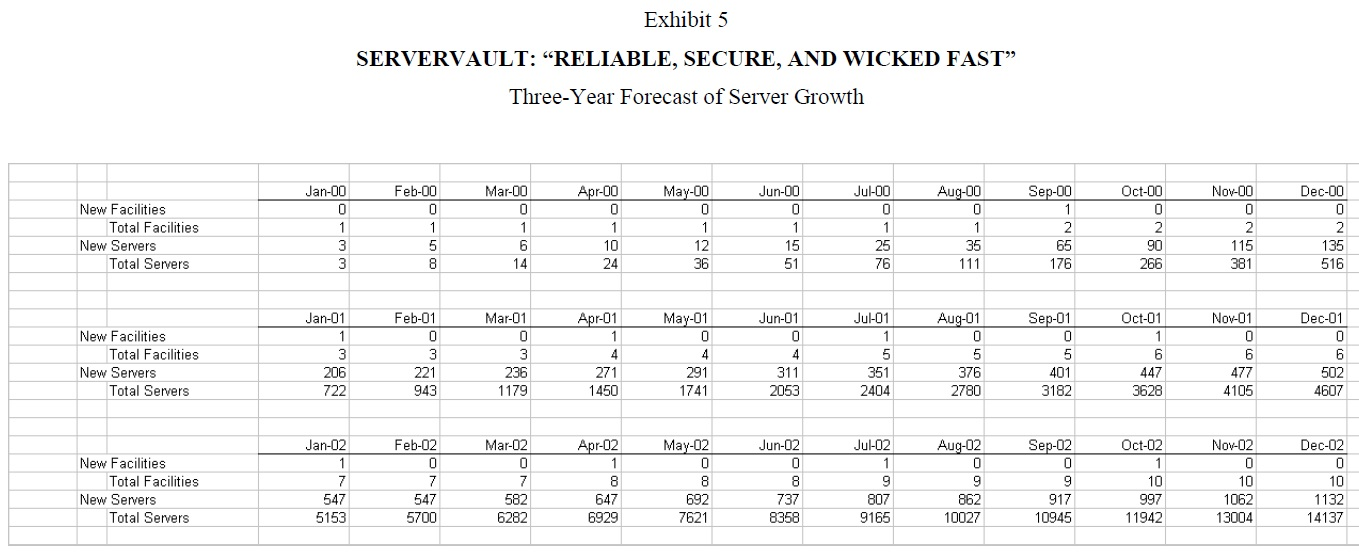
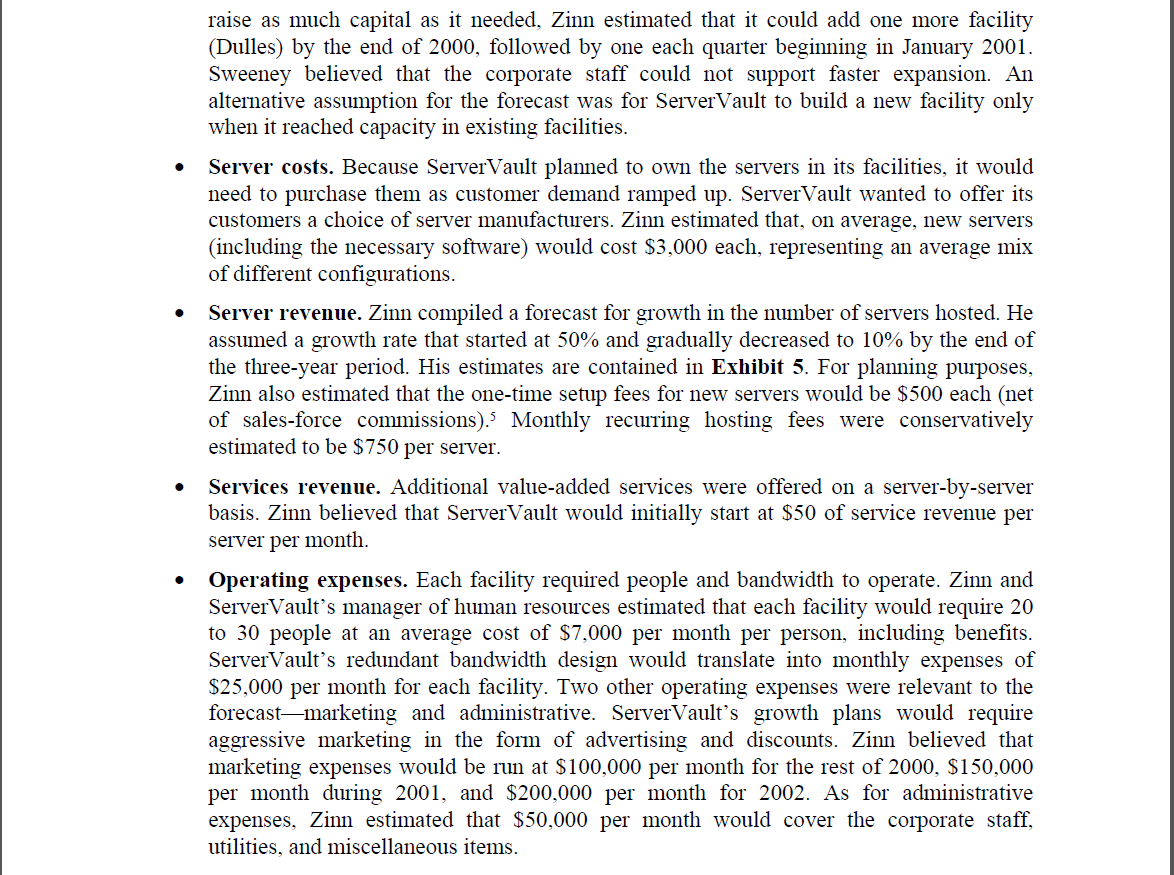
Exhibit 4 SERVERVAULT: "RELIABLE, SECURE, AND WICKED FAST Statement of Cash Flows (direct method) Jan-00 Feb-00 Mar-00 Apr-00 May-00 Jun-00 1,000 2,420 445 3,865 2,500 6,440 350 3,000 10.480 600 14,080 5,000 18,540 1,150 24,690 6,000 26,200 1,900 34,100 7,500 35,480 2,325 45,305 9,290 Cash Flows from Operating Activities Operating Revenues Setup Hosting Services Total Sources Operating Expenses Bandwidth Marketing Salaries G&A (including corp.) Total Uses (3,790) (3,500) (28,250) (9,584) (45,124) (3,790) (22,250) (45,100) (15,484) (86,624) (6,115) (51,750) (54,570) (16,884) (129,319) (5,591) (57,250) (56,600) (22,530) (141,971). (5,591) (51,750) (61,520) (30,160) (149,021) (11,678) (79,800) (62,200) (39,910) (193,588) Net Cash Produced (Used) by Operating Activities (41,259) (77,334) (115,239) (117,281) (114,921) (148,283) Cash Flows from Investing Activities: Capital Expenditures Computer Hardware Facilities (9,800) (10,180) (36,150) (44,890) (14,265) (81.100) (17,770) (29.540) (31,220) (27.590) Net Cash Produced (Used) by Investing Activities (19,980) (95,365) (47,310) (58,810) (36,150) (44,890) Cash Flows from Financing Activities: External funding 47.500 50.000 10.000 2.000.000 Net Cash Produced (Used) by Financing Activities 47,500 50,000 10.000 2,000,000 NET MONTHLY CASH INFLOW (OUTFLOW) (13,739) (122,699) (152,549) (176,091) 1,848,929 (193,173) CASH POSITION Beginning balance Ending Cash Balance 575,000 561,261 561,261 438,562 438,562 286,013 286,013 109,922 109,922 1,958,851 1,958,851 1,765,678 Exhibit 5 SERVERVAULT: "RELIABLE, SECURE, AND WICKED FAST Three-Year Forecast of Server Growth -8 New Facilities Total Facilities New Servers Total Servers Jan-00 0 1 3 3 3 Feb-00 0 1 5 8 Mar-00 0 1 1 6 14 Apr-00 0 1 10 24 May-00 0 1 12 36 Jun-00 0 0 1 15 51 Jul-00 0 1 25 76 Aug-00 0 1 35 111 Sep-00 1 2 65 176 Oct-00 0 2 90 266 Nov-00 0 2 115 381 Dec-00 0 2 135 516 Jun-01 New Facilities Total Facilities New Servers Total Servers Jan-01 1 3 206 722 Feb-01 0 3 221 943 Mar-01 0 3 236 1179 Apr-01 1 4 271 1450 May-01 0 4 291 1741 Jul-01 1 5 351 2404 4 311 2053 Aug-01 0 5 376 2780 Sep-01 0 5 401 3182 Oct-01 1 6 447 3628 Nov-01 0 6 477 4105 Dec-01 0 0 6 6 502 4607 Dec-02 New Facilities Total Facilities New Servers Total Servers Jan-02 1 7 547 5153 Feb-02 0 7 547 5700 Mar-02 0 7 582 6282 Apr-02 1 8 647 6929 May-02 0 8 692 7621 Jun-02 0 8 737 8358 Jul-02 1 9 807 9165 Aug-02 0 9 862 10027 Sep-02 0 9 917 10945 Oct-02 1 10 997 11942 Nov-02 0 10 1062 13004 10 1132 14137 VOOR Financial Forecast Answering those important questions required a monthly forecast of Server Vault's cash flows for the next three years. Sweeney and Zinn discussed several assumptions that would be needed to build the forecast: . Capital expenditures. Each new facility would cost $5 million to $6 million and could hold approximately 5,000 servers, depending on size. Assuming that Server Vault could raise as much capital as it needed, Zinn estimated that it could add one more facility (Dulles) by the end of 2000, followed by one each quarter beginning in January 2001. Sweeney believed that the corporate staff could not support faster expansion. An alternative assumption for the forecast was for Server Vault to build a new facility only when it reached capacity in existing facilities. Server costs. Because Server Vault planned to own the servers in its facilities, it would need to purchase them as customer demand ramped up. ServerVault wanted to offer its customers a choice of server manufacturers. Zinn estimated that, on average, new servers (including the necessary software) would cost $3,000 each, representing an average mix of different configurations. Server revenue. Zinn compiled a forecast for growth in the number of servers hosted. He assumed a growth rate that started at 50% and gradually decreased to 10% by the end of the three-year period. His estimates are contained in Exhibit 5. For planning purposes, Zinn also estimated that the one-time setup fees for new servers would be $500 each (net of sales-force commissions). Monthly recurring hosting fees were conservatively estimated to be $750 per server. Services revenue. Additional value-added services were offered on a server-by-server basis. Zinn believed that Server Vault would initially start at $50 of service revenue per server per month. Operating expenses. Each facility required people and bandwidth to operate. Zinn and ServerVault's manager of human resources estimated that each facility would require 20 to 30 people at an average cost of $7,000 per month per person, including benefits. ServerVault's redundant bandwidth design would translate into monthly expenses of $25,000 per month for each facility. Two other operating expenses were relevant to the forecastmarketing and administrative. Server Vault's growth plans would require aggressive marketing in the form of advertising and discounts. Zinn believed that marketing expenses would be run at $100,000 per month for the rest of 2000, $150,000 per month during 2001, and $200,000 per month for 2002. As for administrative expenses, Zinn estimated that $50,000 per month would cover the corporate staff, utilities, and miscellaneous items. . Exhibit 4 SERVERVAULT: "RELIABLE, SECURE, AND WICKED FAST Statement of Cash Flows (direct method) Jan-00 Feb-00 Mar-00 Apr-00 May-00 Jun-00 1,000 2,420 445 3,865 2,500 6,440 350 3,000 10.480 600 14,080 5,000 18,540 1,150 24,690 6,000 26,200 1,900 34,100 7,500 35,480 2,325 45,305 9,290 Cash Flows from Operating Activities Operating Revenues Setup Hosting Services Total Sources Operating Expenses Bandwidth Marketing Salaries G&A (including corp.) Total Uses (3,790) (3,500) (28,250) (9,584) (45,124) (3,790) (22,250) (45,100) (15,484) (86,624) (6,115) (51,750) (54,570) (16,884) (129,319) (5,591) (57,250) (56,600) (22,530) (141,971). (5,591) (51,750) (61,520) (30,160) (149,021) (11,678) (79,800) (62,200) (39,910) (193,588) Net Cash Produced (Used) by Operating Activities (41,259) (77,334) (115,239) (117,281) (114,921) (148,283) Cash Flows from Investing Activities: Capital Expenditures Computer Hardware Facilities (9,800) (10,180) (36,150) (44,890) (14,265) (81.100) (17,770) (29.540) (31,220) (27.590) Net Cash Produced (Used) by Investing Activities (19,980) (95,365) (47,310) (58,810) (36,150) (44,890) Cash Flows from Financing Activities: External funding 47.500 50.000 10.000 2.000.000 Net Cash Produced (Used) by Financing Activities 47,500 50,000 10.000 2,000,000 NET MONTHLY CASH INFLOW (OUTFLOW) (13,739) (122,699) (152,549) (176,091) 1,848,929 (193,173) CASH POSITION Beginning balance Ending Cash Balance 575,000 561,261 561,261 438,562 438,562 286,013 286,013 109,922 109,922 1,958,851 1,958,851 1,765,678 Exhibit 5 SERVERVAULT: "RELIABLE, SECURE, AND WICKED FAST Three-Year Forecast of Server Growth -8 New Facilities Total Facilities New Servers Total Servers Jan-00 0 1 3 3 3 Feb-00 0 1 5 8 Mar-00 0 1 1 6 14 Apr-00 0 1 10 24 May-00 0 1 12 36 Jun-00 0 0 1 15 51 Jul-00 0 1 25 76 Aug-00 0 1 35 111 Sep-00 1 2 65 176 Oct-00 0 2 90 266 Nov-00 0 2 115 381 Dec-00 0 2 135 516 Jun-01 New Facilities Total Facilities New Servers Total Servers Jan-01 1 3 206 722 Feb-01 0 3 221 943 Mar-01 0 3 236 1179 Apr-01 1 4 271 1450 May-01 0 4 291 1741 Jul-01 1 5 351 2404 4 311 2053 Aug-01 0 5 376 2780 Sep-01 0 5 401 3182 Oct-01 1 6 447 3628 Nov-01 0 6 477 4105 Dec-01 0 0 6 6 502 4607 Dec-02 New Facilities Total Facilities New Servers Total Servers Jan-02 1 7 547 5153 Feb-02 0 7 547 5700 Mar-02 0 7 582 6282 Apr-02 1 8 647 6929 May-02 0 8 692 7621 Jun-02 0 8 737 8358 Jul-02 1 9 807 9165 Aug-02 0 9 862 10027 Sep-02 0 9 917 10945 Oct-02 1 10 997 11942 Nov-02 0 10 1062 13004 10 1132 14137 VOOR Financial Forecast Answering those important questions required a monthly forecast of Server Vault's cash flows for the next three years. Sweeney and Zinn discussed several assumptions that would be needed to build the forecast: . Capital expenditures. Each new facility would cost $5 million to $6 million and could hold approximately 5,000 servers, depending on size. Assuming that Server Vault could raise as much capital as it needed, Zinn estimated that it could add one more facility (Dulles) by the end of 2000, followed by one each quarter beginning in January 2001. Sweeney believed that the corporate staff could not support faster expansion. An alternative assumption for the forecast was for Server Vault to build a new facility only when it reached capacity in existing facilities. Server costs. Because Server Vault planned to own the servers in its facilities, it would need to purchase them as customer demand ramped up. ServerVault wanted to offer its customers a choice of server manufacturers. Zinn estimated that, on average, new servers (including the necessary software) would cost $3,000 each, representing an average mix of different configurations. Server revenue. Zinn compiled a forecast for growth in the number of servers hosted. He assumed a growth rate that started at 50% and gradually decreased to 10% by the end of the three-year period. His estimates are contained in Exhibit 5. For planning purposes, Zinn also estimated that the one-time setup fees for new servers would be $500 each (net of sales-force commissions). Monthly recurring hosting fees were conservatively estimated to be $750 per server. Services revenue. Additional value-added services were offered on a server-by-server basis. Zinn believed that Server Vault would initially start at $50 of service revenue per server per month. Operating expenses. Each facility required people and bandwidth to operate. Zinn and ServerVault's manager of human resources estimated that each facility would require 20 to 30 people at an average cost of $7,000 per month per person, including benefits. ServerVault's redundant bandwidth design would translate into monthly expenses of $25,000 per month for each facility. Two other operating expenses were relevant to the forecastmarketing and administrative. Server Vault's growth plans would require aggressive marketing in the form of advertising and discounts. Zinn believed that marketing expenses would be run at $100,000 per month for the rest of 2000, $150,000 per month during 2001, and $200,000 per month for 2002. As for administrative expenses, Zinn estimated that $50,000 per month would cover the corporate staff, utilities, and miscellaneous items