


Use financial statement ratios to identify a company's primary characteristics and diagnose its
strengths and weaknesses.
Financial fraud is often uncovered by exploring financial statements. This is easier with a public company than a private one, as we will see by studying the fall of health technology cor-portion Theranos. This case study's pre-work article takes a close look at the startup Theranos which was founded and run by Elizabeth Holmes. It is a tale of a 19 year old female startup founder that led her company to a $6 billion evaluation by some in Silicon Valley that turned into a story of lies and corruption. This lesson is designed to help students become more fluent in interpreting financial statement ratios in order to learn more about a company. Using Theranos as a lens, the class activity examines how to construct an income statement and balance sheet. We'll dive deeper into these statements and the value they can bring to investors. You'll learn through reading the pre-work article the value of these statements to investors and what happens when they are largely ignored. The homework Case Study asks students to dissect the finan-cial statements of The Walt Disney Company and describe its structure and drivers. You will be tasked with using the Bloomberg terminal to answer a set of 3 questions that are meant to prove an understanding of financial statements and how they can impact a person's understanding of a company.
Case Questions
1) Using the information on the previous page, identify how Disney makes money,
i.e. where it earns its revenue.
2) Using the Terminal Tutorial at the end of the case study, calculate each
business segment's contribution to Disney's total revenue and operating income.
3) Using the information on the previous page and the data from question 2, what
is the primary driver of revenue for each of Disney's segments.
Financial data below:
Walt Disney co/the (dis us)- by segment
(see comment section it was too long for the orginial question) DONT ANSWER without looking at the data.
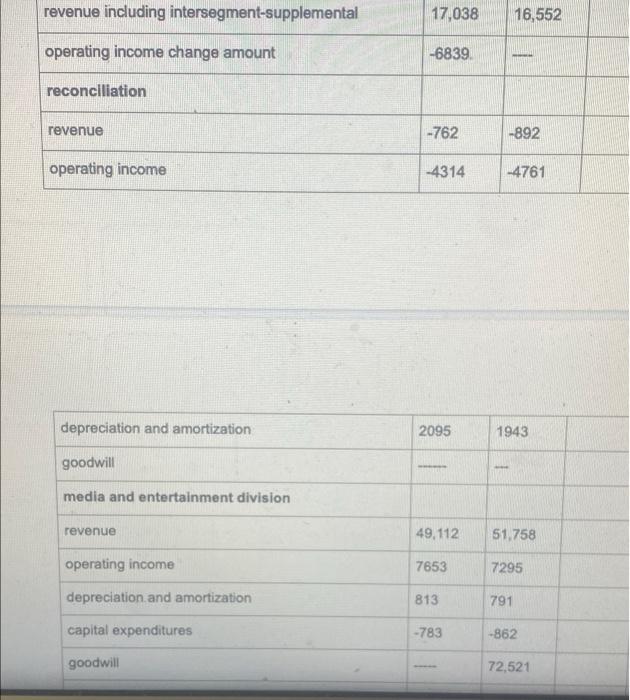
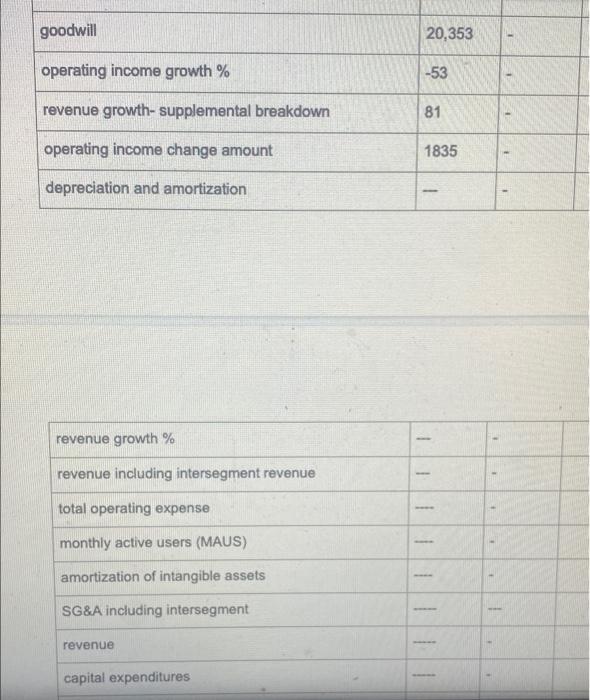
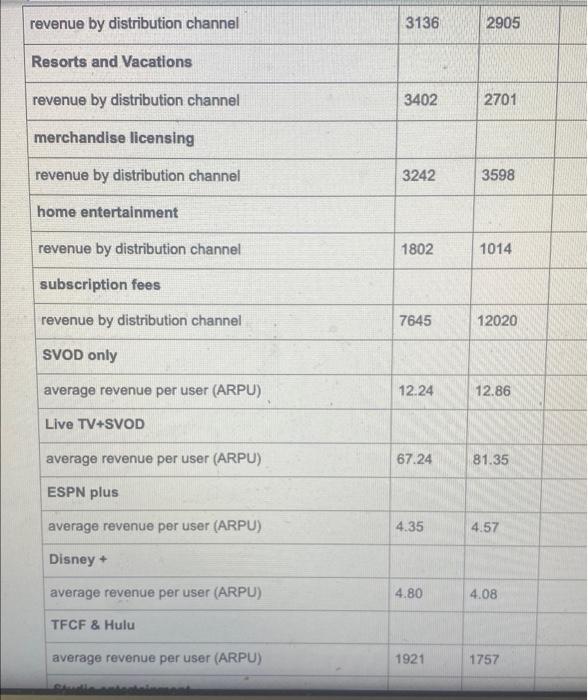
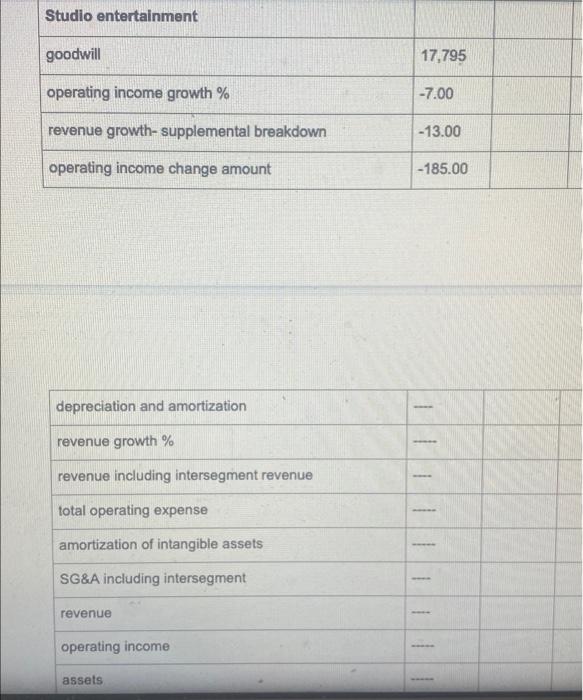
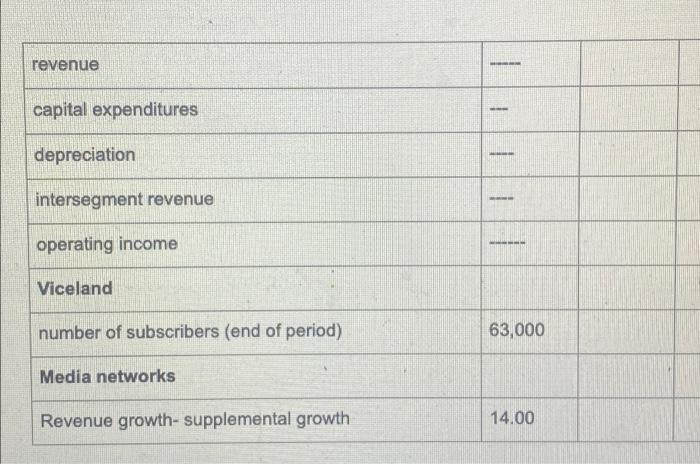
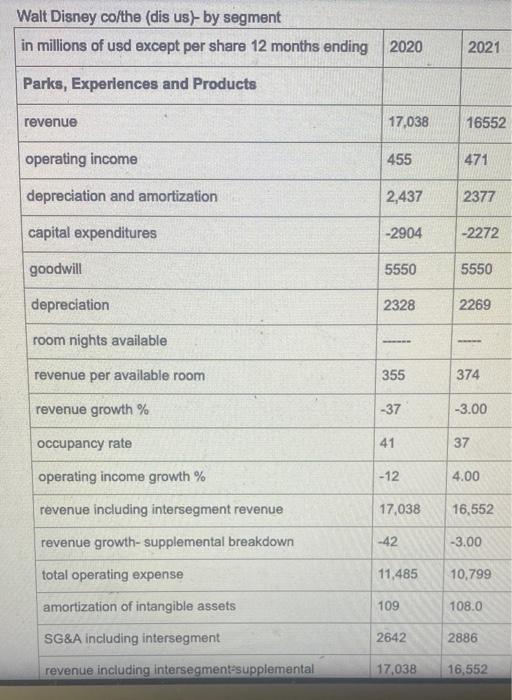
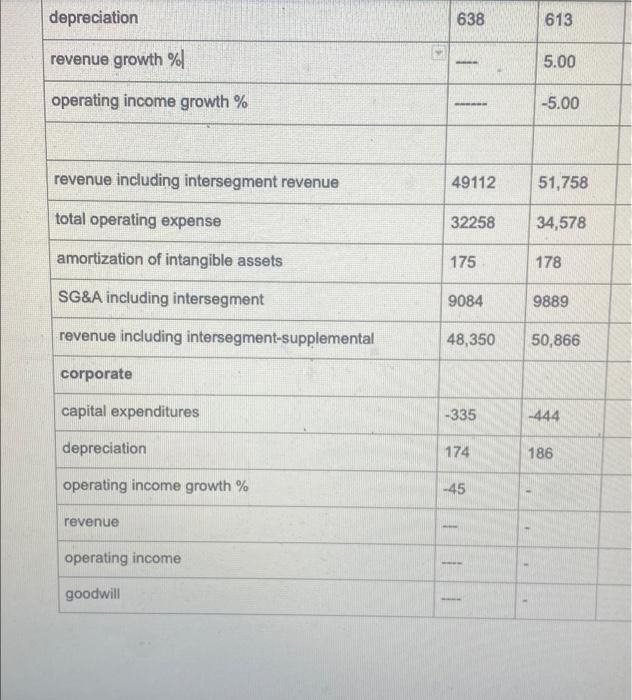
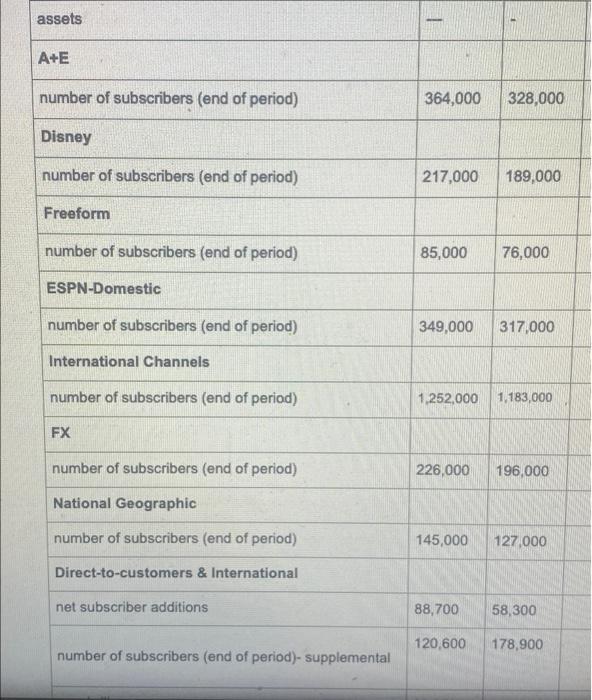
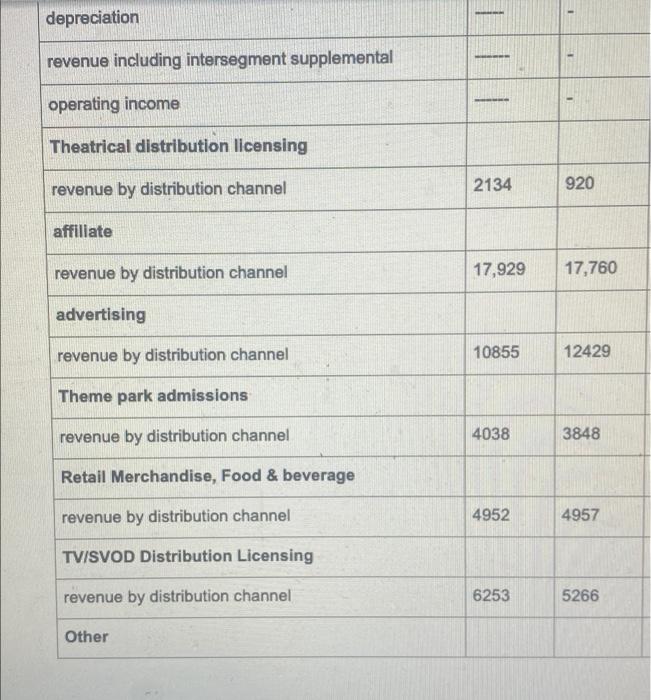
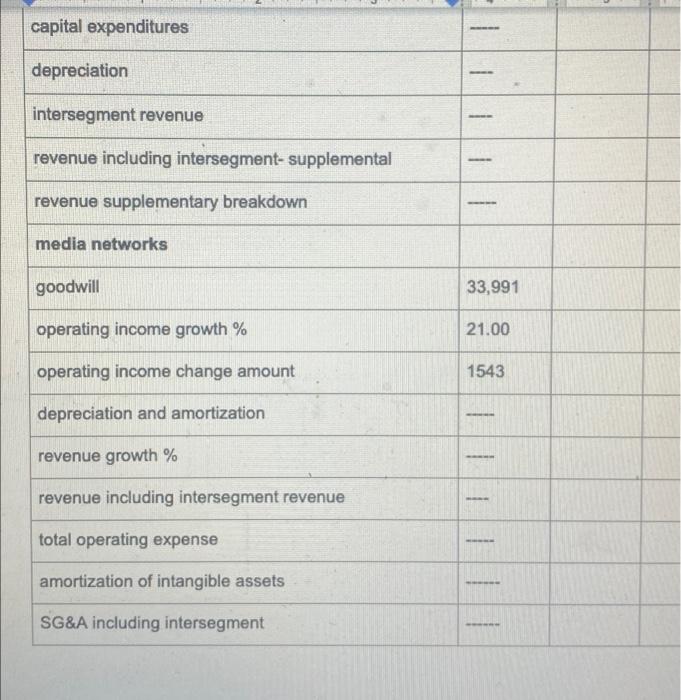
Walt Disney co/the (dis us)- by segment in millions of usd except per share 12 months ending 2020 Parks, Experiences and Products revenue 17,038 operating income 455 depreciation and amortization 2,437 capital expenditures -2904 goodwill 5550 depreciation 2328 room nights available revenue per available room 355 revenue growth % occupancy rate operating income growth % revenue including intersegment revenue revenue growth-supplemental breakdown total operating expense amortization of intangible assets SG&A including intersegment revenue including intersegment-supplemental -37 41 -12 17,038 -42 11,485 109 2642 17,038 2021 16552 471 2377 -2272 5550 2269 ---- 374 -3.00 37 4.00 16,552 -3.00 10,799 108.0 2886 16,552 revenue including operating income change amount reconciliation revenue operating income depreciation and amortization goodwill media and entertainment division revenue operating income depreciation and amortization capital expenditures goodwill intersegment-supplemental 17,038 -6839. -762 -4314 2095 - 49,112 7653 813 -783 16,552 www.w -892 -4761 1943 A 51,758 7295 791 -862 72,521 depreciation revenue growth % operating income growth % revenue including intersegment revenue total operating expense amortization of intangible assets SG&A including intersegment revenue including intersegment-supplemental corporate capital expenditures depreciation operating income growth % revenue operating income goodwill 638 613 - 5.00 -5.00 49112 51,758 32258 34,578 175 178 9084 9889 48,350 50,866 -335 -444 174 186 -45 1 [MM] T assets A+E number of subscribers (end of period) Disney number of subscribers (end of period) Freeform number of subscribers (end of period) ESPN-Domestic number of subscribers (end of period) International Channels number of subscribers (end of period) FX number of subscribers (end of period) National Geographic number of subscribers (end of period) Direct-to-customers & International net subscriber additions number of subscribers (end of period)- supplemental 364,000 328,000 217,000 189,000 85,000 76,000 349,000 317,000 1,252,000 1,183,000 226,000 196,000 145,000 127,000 88,700 58,300 120,600 178,900 goodwill operating income growth % revenue growth- supplemental breakdown operating income change amount depreciation and amortization revenue growth % revenue including intersegment revenue total operating expense monthly active users (MAUS) amortization of intangible assets SG&A including intersegment revenue capital expenditures 20,353 -53 81 1835 - 1 1 ---- E - E * depreciation revenue including intersegment supplemental operating income Theatrical distribution licensing revenue by distribution channel affiliate revenue by distribution channel advertising revenue by distribution channel Theme park admissions revenue by distribution channel Retail Merchandise, Food & beverage revenue by distribution channel TV/SVOD Distribution Licensing revenue by distribution channel Other I 2134 920 17,929 17,760 10855 12429 4038 3848 4952 4957 6253 5266 revenue by distribution channel Resorts and Vacations revenue by distribution channel merchandise licensing revenue by distribution channel home entertainment revenue by distribution channel subscription fees revenue by distribution channel SVOD only average revenue per user (ARPU) Live TV+SVOD average revenue per user (ARPU) ESPN plus average revenue per user (ARPU) Disney + average revenue per user (ARPU) TFCF & Hulu average revenue per user (ARPU) 3136 3402 3242 1802 7645 12.24 67.24 4.35 4.80 1921 2905 2701 3598 1014 12020 12.86 81.35 4.57 4.08 1757 Studio entertainment goodwill operating income growth % revenue growth- supplemental breakdown operating income change amount depreciation and amortization revenue growth % revenue including intersegment revenue total operating expense amortization of intangible assets SG&A including intersegment revenue operating income assets 17,795 -7.00 -13.00 -185.00 --- capital expenditures depreciation intersegment revenue revenue including intersegment- supplemental revenue supplementary breakdown media networks goodwill operating income growth % operating income change amount depreciation and amortization revenue growth % revenue including intersegment revenue total operating expense amortization of intangible assets SG&A including intersegment ||||||| 33,991 21.00 1543 revenue capital expenditures depreciation intersegment revenue operating income Viceland number of subscribers (end of period) Media networks Revenue growth- supplemental growth --- www. 63,000 14.00