Question
Use following data to draw a yield curve using X-Y graphing method in Microsoft Excel Maturity Period overnight 1 month 3 months 6 months 1
Use following data to draw a yield curve using X-Y graphing method in Microsoft Excel

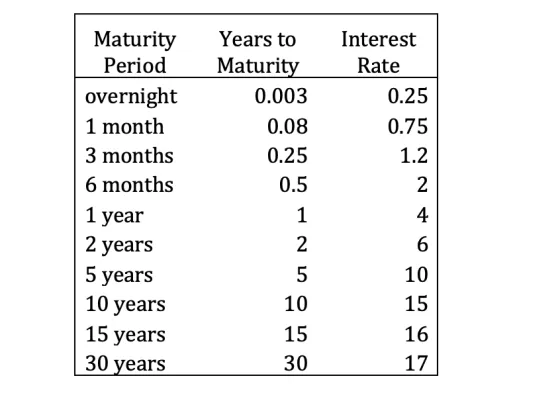
Maturity Period overnight 1 month 3 months 6 months 1 year 2 years 5 years 10 years 15 years 30 years Years to Maturity 0.003 0.08 0.25 0.5 1 2 5 10 15 30 Interest Rate 0.25 0.75 1.2 2 4 6 10 15 16 17
Step by Step Solution
There are 3 Steps involved in it
Step: 1

Get Instant Access to Expert-Tailored Solutions
See step-by-step solutions with expert insights and AI powered tools for academic success
Step: 2

Step: 3

Ace Your Homework with AI
Get the answers you need in no time with our AI-driven, step-by-step assistance
Get StartedRecommended Textbook for
Corporate Finance
Authors: Stephen Ross, Randolph Westerfield, Jeffrey Jaffe, Gordon Ro
7th Canadian Edition
007090653X, 978-0070906532, 978-0071339575
Students also viewed these Economics questions
Question
Answered: 1 week ago
Question
Answered: 1 week ago
Question
Answered: 1 week ago
Question
Answered: 1 week ago
Question
Answered: 1 week ago
Question
Answered: 1 week ago
Question
Answered: 1 week ago
Question
Answered: 1 week ago
Question
Answered: 1 week ago
Question
Answered: 1 week ago
Question
Answered: 1 week ago
Question
Answered: 1 week ago
Question
Answered: 1 week ago
Question
Answered: 1 week ago
Question
Answered: 1 week ago
Question
Answered: 1 week ago
Question
Answered: 1 week ago
Question
Answered: 1 week ago
Question
Answered: 1 week ago
Question
Answered: 1 week ago
Question
Answered: 1 week ago
View Answer in SolutionInn App


