Use Geogebra to work on the topics of Calculus including: calculate derivatives, use rectangle sum to understand integrals, infinite Integrals, definite integrals to calculate areas, improper integrals (in CAS). Create a document with screen shot in the format of the document attached.
Make your own questions and solve them through geogebra. ( 1question for each. Total: 5 questions)
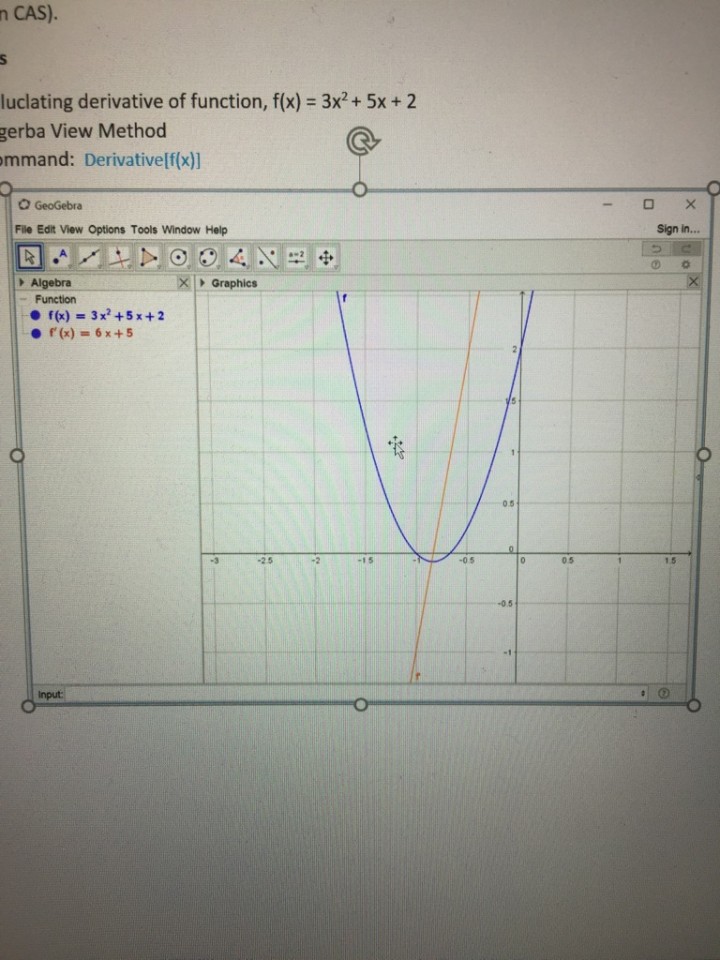
1.calculate derivatives,
2.use rectangle sum to understand integrals
3.infinite Integrals
4.definite integrals to calculate
5.improper integrals (in CAS)
See the attached file on how to use geogebra if you need.
This is a simple example. Please refer to the pictures below
\fQuantitative Methodology Lab Exercises With Geogebra GeoGebra is open source dynamic mathematics software for learning and teaching at all levels. It is a very powerful and efficient tool, especially in visualizing all the mathematics models. This document covers the commands and tools of GeoGebra 5.0 needed for the course of Quantitative Methodology (360-300-AS) Lab Exercises, also the exercise questions. Depending on your hardware and preferences, you can choose from www.geogebra.org between Download-icons-device-screen.png GeoGebra 5.0 Desktop and the Download-icons-device-tablet.png GeoGebra 5.0 Web and Tablet App, which feature minor differences in terms of use and interface design. Objectives 1. Help students to visualize the mathematics models because most students are relatively weak in abstract imagination. 2. Help students to validate their solutions on paper to improve their ability and confidence of working independently. 3. Integrate the modern tools with the traditional theory to solve practical problems. 4. Motivate the study interests of the students. Install Geogebra 1. Go to webpage: www.geogebra.org 2. Click Downloads Icon, you will have the following screen. 3. Download the software according to your computer system. 4. You can also download the software to your pad from Apple Store, Window Store and Google Store. 1 GeoGebra Spreedsheet Section 1. Spreedsheet Start GeoGebra by double clicking the Icon and you will have the following screen: In the GeoGebra Math Apps Manual Box, click on the Spreedsheet A) Entering data and creating objects In GeoGebra's Spreadsheet View every cell has a specific name that allows you to directly address each cell. Example: The cell in column A and row 1 is named A1. You may use the Spreadsheet cells in order to create mathematical objects that are directly displayed in the Graphics View (e.g. points). Task 1 1 A1 Enter the number 10 into cell A1. Hint: Always confirm your input by pressing the Enter key. 2 B1 Enter the coordinates (-2, 2) into cell B1. Note: The point B1 = (-2, 2) is automatically shown in the Graphics View. 3 Select the Move tool and drag point B1 in the Graphics View. Note: The Spreadsheet View shows the current position of point B1 in cell B1 as shown below. 2 4 Delete the content of cell B1. Cell references You may refer to another cell by using its name in your new input. Note: If the content of this cell is modified, the new input adapts automatically. Task 2 1 A1 Change the number in cell A1 to 1.5 and confirm your input. 2 Enter the formula = 2 * into cell B1 and then select cell A1 in order to insert its name into the formula. Confirm your input. Note: GeoGebra calculates 2 * 1.5 and displays the solution 3 in cell B1. B1 3 A1 Change the content of cell A1 to 3. Note: The content of cell B1 automatically adapts to your changes. Task 3 1 C1 Enter the coordinates (A1, B1) into cell C1 and confirm your input. Hint: Cell C1 now shows the coordinates (3, 6). The corresponding Point C1 is automatically displayed in the Graphics View. 2 A1 Change the value of cell A1 to 2. Note: The coordinates in cell C1 and the corresponding point automatically adapt to your changes. NOTES 1. Numbers in ( ) are treated as coordinates. 2. Cell name can be used to represent the value in that cell. B) Relative copy Using relative copy, you can easily create number sequences or apply formulas to a series of numbers. Note: If you relative copy formulas to other cells, by default all references are changed according to the target position. Task 1 Create a number sequence in column A. 1. 2. A1 3. 4. A2 Enter 1 into cell A1 and 2 into cell A2. Highlight both cells A1 and A2 and drag the little square in the lower right corner of the highlighted area down to cell A10. Note: You just used relative copy in order to create the integers from 1 to 10 in cells A1 to A10. Change the number in cell A2 to 3. Highlight both cells A1 and A2 again and relative copy the new values to the other cells in order to update the number sequence. 3 Task 2 Relative copy a formula that contains cell references. 5 B1 Enter the formula =A1/2 into cell B1. 6 Relative copy the formula from cell B1 down to cell B10. Hint: Only select cell B1 and drag the lower right corner of the highlighted area in order to relative copy its formula to the other cells. 7 Double click on any cell in column B in order to check which formula calculated the number value. 8 A2 Change the number in cell A2 to 5 and update the number sequence by using relative copy. Note: All numbers in column B will adapt to your changes. NOTES 1. Double click on the cell will show the formula used. Absolute Copy If you want to refer to a specific cell while using relative copy, you may add the $ symbol to the cell name (e.g. $C$1). Task 3 9. C1 Enter the number 4 into cell C1 and confirm your input. 10 B1 Change the formula in cell B1 to =A1*$C$1. Relative copy the new formula of cell B1 down to cell B10. Note: You just multiplied each value of column A by 4. 11 12 C1 Change the number in cell C1 to 10. Note: All values in column B will automatically adapt to your change. What are Tools? The Spreadsheet View provides a Toolbar with a selection of Tools specific for working with a spreadsheet. You may activate a Tool by clicking on the button showing the corresponding icon. Task Calculate the sum of a series of numbers using the Sum tool. 1 Use the Move tool to highlight all cells of column B that contain numbers. 2 Select the Sum tool from the Spreadsheet View Toolbar. Note: The sum of the numbers in the highlighted cells is displayed in the next empty cell of column B. 4 What are Toolboxes? GeoGebra's Tools are organized in Toolboxes, containing similar Tools or Tools that generate the same type of new object. You can open a Toolbox by clicking on a Tool button and selecting a Tool from the appearing list. Task Create a list of points based on the numbers provided in the spreadsheet. 1 Use the Move tool to highlight all cells of columns B and C down to row 6. 2 Select the List of Points tool from the Spreadsheet View Toolbar. In the appearing dialog window, press Create in order to create points from your data set. Note: The values in column B determine the x-coordinates and the values in column C specify the y-coordinates of the plotted points. How to combine the Spreadsheet and Graphics View If possible, GeoGebra immediately displays the graphical representation of the object you entered in a Spreadsheet Cell in the Graphics View as well. Note: The name of the object matches the name of the Spreadsheet Cell used to initially create it (e. g. A5, C1). Task 1 1 A1 Enter y = 0.5x into cell A1 and press the Enter key. 5 2 A2 Enter the coordinates (1, 3) into cell A2. 3 Click in the Graphics View to show the Graphics View Toolbar. 4 Activate the Parallel Line tool. Successively, select the line A1 and point A2 in order to create a parallel line through point A2. Task 2 1 A1 Highlight both cells A1 and A2 and drag the little square in the lower right corner of the highlighted area down to cell A12. 2 3 Enter 1 in cell A1 and 2 in A2. B1 Enter 1 in cell B1 and the formula =2*B1 in cell B2. 4 Relative copy the formula from cell B2 down to cell B12. Hint: Only select cell B2 and drag the lower right corner of the highlighted area in order to relative copy its formula to the other cells. 5 Highlight the cells A1 to B12 and use the tool List of Points. Note: The points will be displayed in the Graphics View. 6 Task 3 1 C2 Enter the Command =Factors[B2] in cell C2 and press the Enter key. Note: The Factors command lists the prime factors of a number together with their corresponding exponents. Example: ab is displayed as (a b). 2 Relative copy the content of cell C2 down to cell C12. 3 Compare the values in column B to the corresponding values in column C. Quick Tricks 1 1. After start GeoGebra and selected Spreedsheet, how to change to other selection such as Probability? View 2. After start GeoGebra and selected Spreedsheet, only the tools for Graphics show up, how to bring up the tools for Algebra? And then bring up tools for Graphics? Clicks on Spreedsheet or Graphics to bring up their tool. 3. After start GeoGebra and selected Spreedsheet, delete Algebra or Graphics, how to bring it back? View Lab Exercise 1 Put one grain in the first square, then the number of grains in each square doubles every time (1 grain in 1st square, 2 grains in 2nd square, 4 grains in 3rd square, 8 grains in 4th square). Create 2 mathematical models (using the methods of Task 2 and Task 3) that allow you to determine the number of grains on each of the 64 chess squares and total number of grains. 7 The Spreadsheet View Toolbar The Spreadsheet Tools are organized in GeoGebra's Spreadsheet View Toolbar: Familiarize yourself with GeoGebra's Spreadsheet Tools 1. List of Points Highlight all cells of columns A and B that contain data. Then, select the tool List of Points from the Spreadsheet View Toolbar. In the appearing dialog window you may... change the name of the list. decide which column should determine the x- and the y-coordinate of the points. check the preview of the list of points. select Create in order to create points from your data set. Note: Using this tool you can create a Scatter Plot from the data. The resulting list of points is also shown in the Algebra View. 2. Polyline Select a set of spreadsheet cells, where the selected cells form pairs across rows or columns. Then, activate the tool Polyline to open a dialog for naming, modifying and creating a polyline. Click Create and the points and the polyline are shown in the Graphics View. 8 3. Sum Highlight all cells whose numbers you would like to add up and then, select the Sum tool. Note: The sum is displayed in the next empty cell of the highlighted column. Quick Tricks 2: Selected Spreadsheet Tools for data analysis One Variable Analysis Highlight all cells of column A that contain data and then activate the tool One Variable Analysis. In the appearing dialog you may display the following information: Graphs: You may display one or two different graphs (e.g. histogram, boxplot), which you can select from a list. Statistics: The statistical Analysis of the data is displayed in a table. Data: The analyzed data is displayed in a table. Note: By default, only one of the graph panels is displayed. You may display the other panels by using the Style Bar of the dialog window. Settings: You may modify the settings of the selected graph. Export: You may copy a graph to the Graphics View or export it as an image file. Conduct a One Variable Analysis of the given data and display the statistical values in a table. Instructions 1 Use the mouse to highlight all cells of column A that contain numbers. 2 Select the One Variable Analysis tool to show the diagram in the Data Analysis Window. 3 Select Show Statistics in the Data Analysis Window to see the statistic parameters of the data. Conduct a Two Variable Analysis of the given data and display the statistical values in a table. Instructions 1 Use the mouse to highlight all cells of columns A and B that contain numbers. 2 Select the Two Variable Analysis tool to show the diagram in the Data Analysis Window. 3 Select Show Statistics in the Data Analysis Window to see the statistic parameters of the data. 9 4 Below the Data Analysis Window you may choose from a variety of Regression Models (e.g. Linear or Polynom). GeoGebra Probablity Section 10 \f\f\f\f\f