Answered step by step
Verified Expert Solution
Link Copied!

Question

1 Approved Answer

use matlab 09 1 (5P) Create a text file, savings.dat that stores average household savings by first and second halves of the last 5 years.

use matlab image text in transcribed
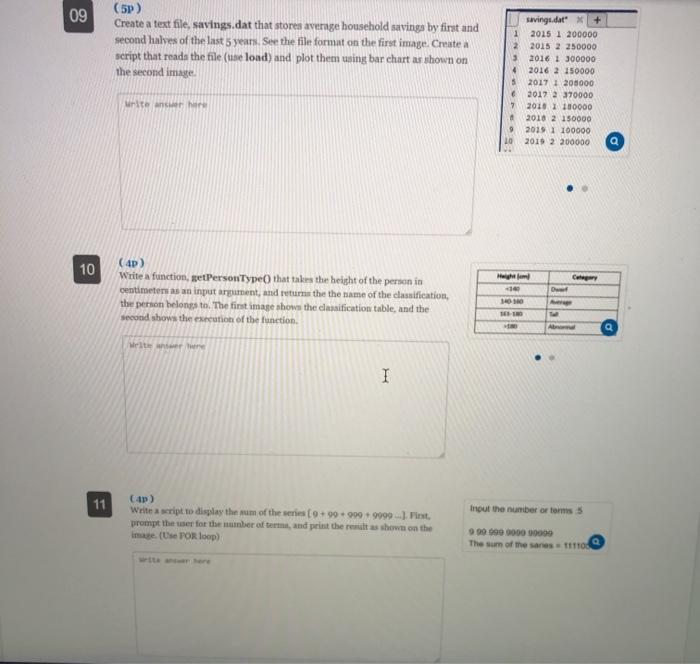
09 1 (5P) Create a text file, savings.dat that stores average household savings by first and second halves of the last 5 years. See the file format on the first image. Create a script that reads the file (use load) and plot them using bar chart as shown on the second image 2 3 4 5 savings.dat" x + 2015 1 200000 2015 2 250000 2016 1 300000 2016 2 150000 2017 1 208000 2012 2 370000 2010 1 150000 2010 2 150000 2019 1 100000 2019 2 200000 writer 7 LO 10 Helm Du (4) Write a function, getPersonType() that takes the height of the person in centimeters as an input argument, and returns the the name of the classification, the person belongs to. The fint image shown the classification table, and the second shows the execution of the function. 14010 I I 11 C4p) Write a script to display the sum of the series (9 +90 +909 +9999.). Pint prompt the user for the number of terms, and print the rest as shown on the image (Use POR loop) Inout the number or terms 5 000 000 000000000 The sum of the sanes 111100

Step by Step Solution

There are 3 Steps involved in it

Step: 1

blur-text-image

Get Instant Access to Expert-Tailored Solutions

See step-by-step solutions with expert insights and AI powered tools for academic success

Step: 2

blur-text-image

Step: 3

blur-text-image

Ace Your Homework with AI

Get the answers you need in no time with our AI-driven, step-by-step assistance

Get Started

Recommended Textbook for

Larry Ellison Database Genius Of Oracle

Authors: Craig Peters

1st Edition

0766019748, 978-0766019744

More Books

Students also viewed these Databases questions