

Question
Use Matlab or Excel to plot three normal distribution curves as shown in the figure with: 1=1; 2=2; 3=3; statistical means are all zero Plot
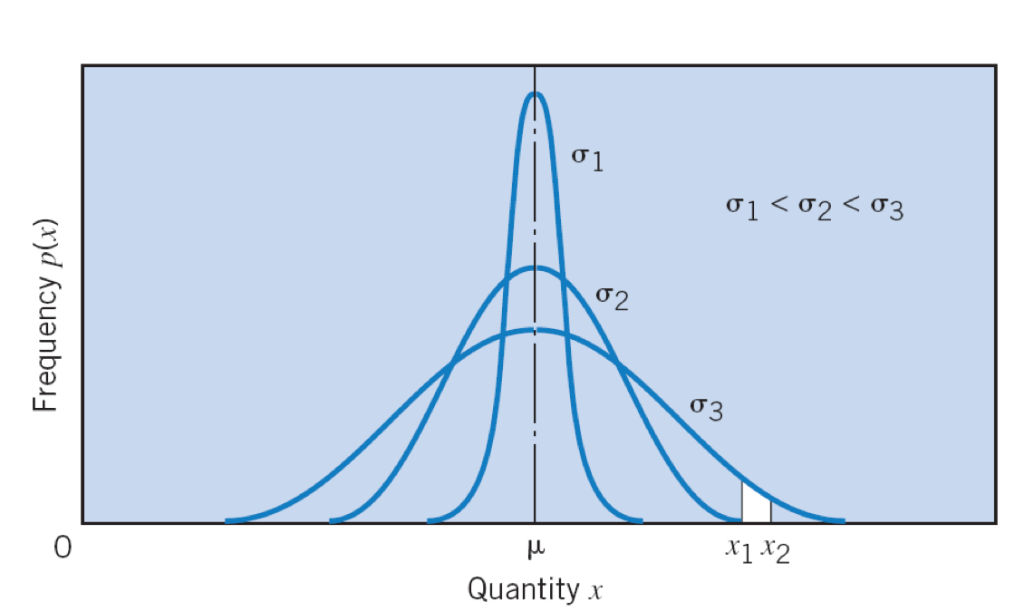
Use Matlab or Excel to plot three normal distribution curves as shown in the figure with:
1=1; 2=2; 3=3;
statistical means are all zero
Plot the three curves on one plot with axes numbered and labeled
Step by Step Solution
There are 3 Steps involved in it
Step: 1

Get Instant Access to Expert-Tailored Solutions
See step-by-step solutions with expert insights and AI powered tools for academic success
Step: 2

Step: 3
Ace Your Homework with AI
Get the answers you need in no time with our AI-driven, step-by-step assistance
Get Started
Transactions On Large Scale Data And Knowledge Centered Systems Xxiv Special Issue On Database And Expert Systems Applications Lncs 9510
Authors: Abdelkader Hameurlain ,Josef Kung ,Roland Wagner ,Hendrik Decker ,Lenka Lhotska ,Sebastian Link
1st Edition
366249213X, 978-3662492130