

Answered step by step
Verified Expert Solution
Question
1 Approved Answer
Use Matlab to solve. Implement a simple cell with a vertical RF and a half-wave squaring output nonlinearity. As RF use a 2D Gabor function:
Use Matlab to solve.
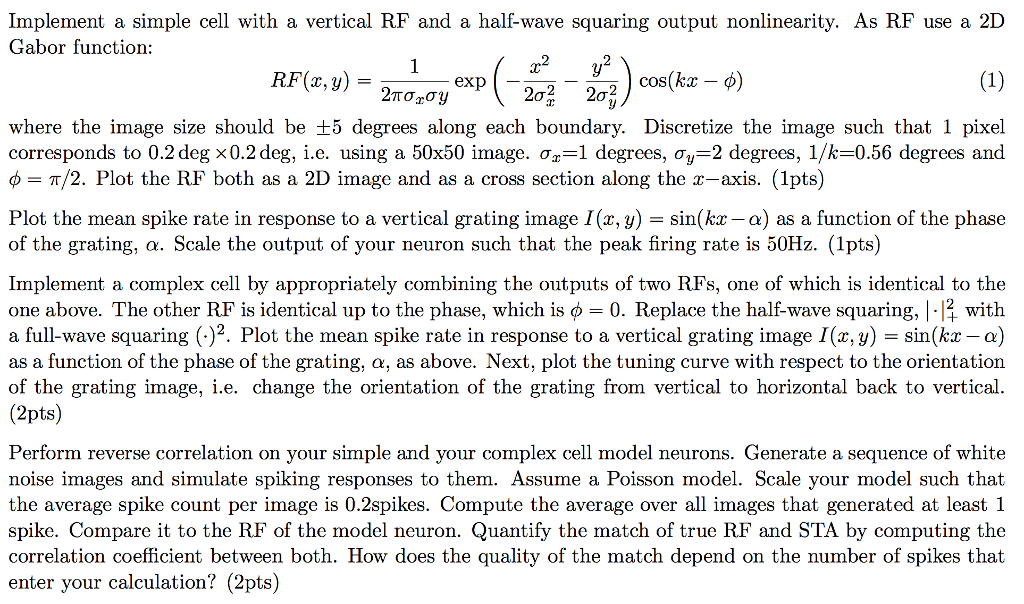
Implement a simple cell with a vertical RF and a half-wave squaring output nonlinearity. As RF use a 2D Gabor function: RF(x,y) = TC exp cos(kx-d) 22 202 where the image size should be 5 degrees along each boundary. Discretize the image such that 1 pixel corresponds to 0.2 deg x 0.2 deg, i.e. using a 50x50 image. ,-1 degrees, ,-2 degrees, 1/k-0.56 degrees and = /2. Plot the RF both as a 2D image and as a cross section along the x-axis. (1pts) Plot the mean spike rate in response to a vertical grating image I(x, y) = sin(kx-a) as a function of the phase of the grating, . Scale the output of your neuron such that the peak firing rate is 50Hz. (1pt) Implement a complex cell by appropriately combining the outputs of two RFs, one of which is identical to the one above. The other RF is identical up to the phase, which is = 0. Replace the half-wave squaring, . with a full-wave squaring (-)2. Plot the mean spike rate in response to a vertical grating image I(x, y) - sin(kx - a) as a function of the phase of the grating, , as above. Next, plot the tuning curve with respect to the orientation of the grating image, i.e. change the orientation of the grating from vertical to horizontal back to vertical. (2pts) Perform reverse correlation on your simple and your complex cell model neurons. Generate a sequence of white noise images and simulate spiking responses to them. Assume a Poisson model. Scale your model such that the average spike count per image is 0.2spikes. Compute the average over all images that generated at least 1 spike. Compare it to the RF of the model neuron. Quantify the match of true RF and STA by computing the correlation coefficient between both. How does the quality of the match depend on the number of spikes that enter your calculation? (2pts) Implement a simple cell with a vertical RF and a half-wave squaring output nonlinearity. As RF use a 2D Gabor function: RF(x,y) = TC exp cos(kx-d) 22 202 where the image size should be 5 degrees along each boundary. Discretize the image such that 1 pixel corresponds to 0.2 deg x 0.2 deg, i.e. using a 50x50 image. ,-1 degrees, ,-2 degrees, 1/k-0.56 degrees and = /2. Plot the RF both as a 2D image and as a cross section along the x-axis. (1pts) Plot the mean spike rate in response to a vertical grating image I(x, y) = sin(kx-a) as a function of the phase of the grating, . Scale the output of your neuron such that the peak firing rate is 50Hz. (1pt) Implement a complex cell by appropriately combining the outputs of two RFs, one of which is identical to the one above. The other RF is identical up to the phase, which is = 0. Replace the half-wave squaring, . with a full-wave squaring (-)2. Plot the mean spike rate in response to a vertical grating image I(x, y) - sin(kx - a) as a function of the phase of the grating, , as above. Next, plot the tuning curve with respect to the orientation of the grating image, i.e. change the orientation of the grating from vertical to horizontal back to vertical. (2pts) Perform reverse correlation on your simple and your complex cell model neurons. Generate a sequence of white noise images and simulate spiking responses to them. Assume a Poisson model. Scale your model such that the average spike count per image is 0.2spikes. Compute the average over all images that generated at least 1 spike. Compare it to the RF of the model neuron. Quantify the match of true RF and STA by computing the correlation coefficient between both. How does the quality of the match depend on the number of spikes that enter your calculation? (2pts)Step by Step Solution
There are 3 Steps involved in it
Step: 1

Get Instant Access to Expert-Tailored Solutions
See step-by-step solutions with expert insights and AI powered tools for academic success
Step: 2

Step: 3
Ace Your Homework with AI
Get the answers you need in no time with our AI-driven, step-by-step assistance
Get Started
Professional Microsoft SQL Server 2014 Integration Services
Authors: Brian Knight, Devin Knight
1st Edition
1118850904, 9781118850909