Question
Use python to solve year2014.txt is Distribution of wage earners by level of net compensation Net compensation interval Number Cumulative Number Percent of total Aggregate
Use python to solve

year2014.txt is
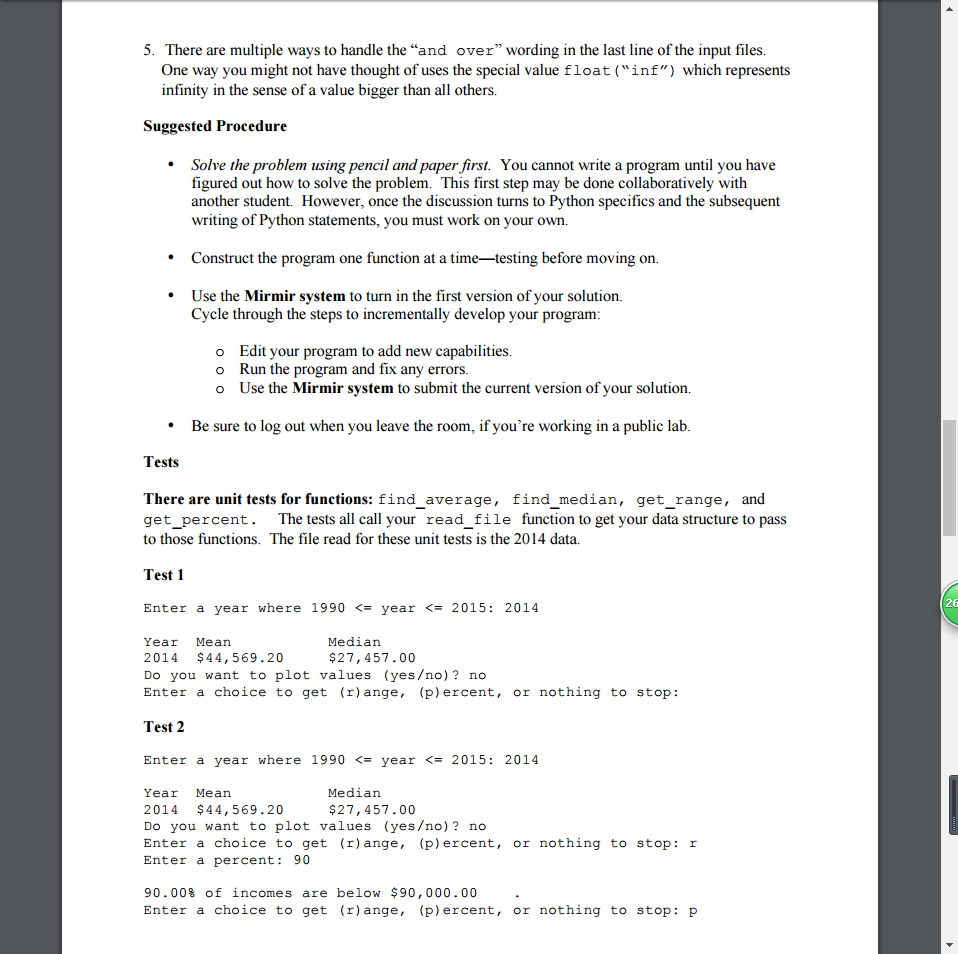
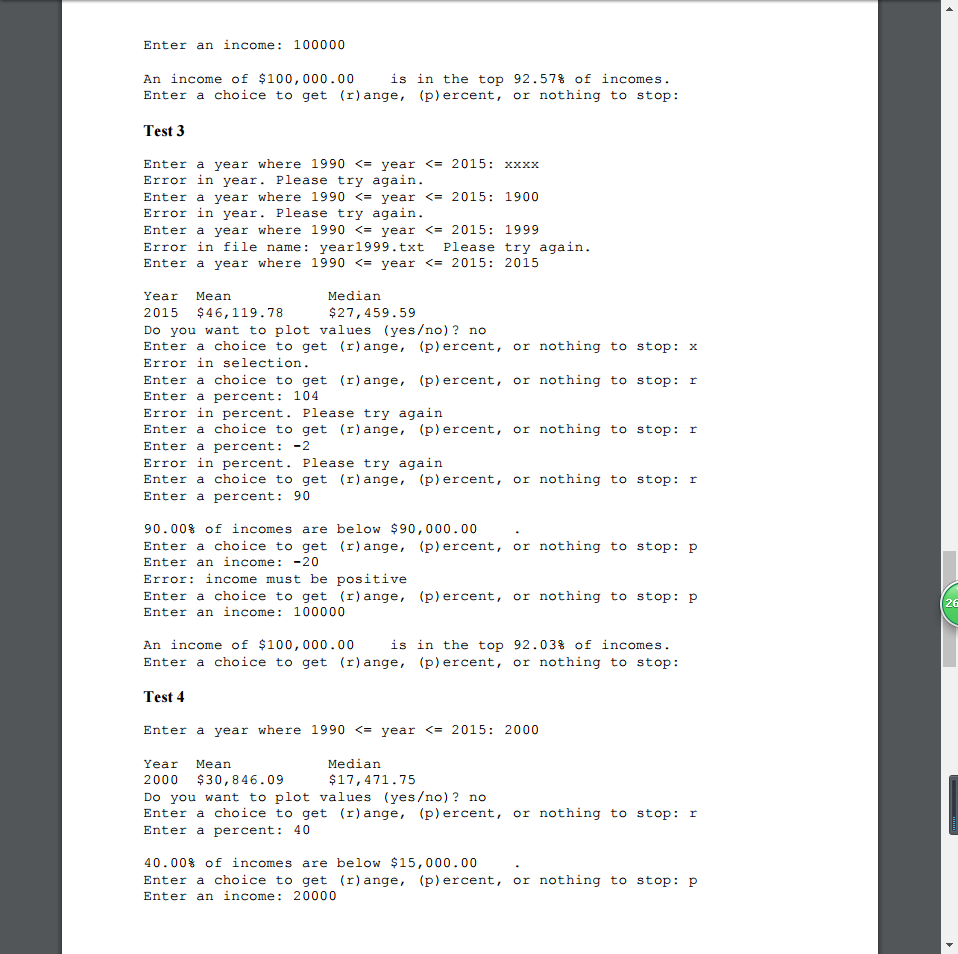
Distribution of wage earners by level of net compensation Net compensation interval Number Cumulative Number Percent of total Aggregate amount Average amount 0.01 - 4,999.99 22,574,440 22,574,440 14.27075 46,647,919,125.68 2,066.40 5,000.00 - 9,999.99 13,848,841 36,423,281 23.02549 102,586,913,092.61 7,407.62 10,000.00 - 14,999.99 12,329,270 48,752,551 30.81961 153,566,802,438.45 12,455.47 15,000.00 - 19,999.99 11,505,776 60,258,327 38.09315 200,878,198,035.07 17,458.90 20,000.00 - 24,999.99 10,918,555 71,176,882 44.99547 245,317,570,246.88 22,467.95 25,000.00 - 29,999.99 10,192,863 81,369,745 51.43903 279,865,461,187.05 27,457.00 30,000.00 - 34,999.99 9,487,840 90,857,585 57.43690 307,828,947,411.16 32,444.58 35,000.00 - 39,999.99 8,578,215 99,435,800 62.85974 321,200,755,103.44 37,443.78 40,000.00 - 44,999.99 7,553,972 106,989,772 67.63509 320,563,569,965.15 42,436.43 45,000.00 - 49,999.99 6,542,882 113,532,654 71.77126 310,391,706,424.23 47,439.60 50,000.00 - 54,999.99 5,723,269 119,255,923 75.38931 300,016,377,448.51 52,420.46 55,000.00 - 59,999.99 4,846,517 124,102,440 78.45310 278,354,367,841.41 57,433.90 60,000.00 - 64,999.99 4,201,232 128,303,672 81.10897 262,203,932,128.68 62,411.20 65,000.00 - 69,999.99 3,573,471 131,877,143 83.36799 240,948,179,180.40 67,426.93 70,000.00 - 74,999.99 3,094,739 134,971,882 85.32437 224,145,278,103.36 72,427.85 75,000.00 - 79,999.99 2,684,481 137,656,363 87.02140 207,853,372,824.62 77,427.77 80,000.00 - 84,999.99 2,297,338 139,953,701 88.47370 189,370,862,869.17 82,430.56 85,000.00 - 89,999.99 1,975,400 141,929,101 89.72248 172,719,042,418.70 87,434.97 90,000.00 - 94,999.99 1,714,370 143,643,471 90.80624 158,442,931,588.44 92,420.50 95,000.00 - 99,999.99 1,486,636 145,130,107 91.74604 144,858,203,365.61 97,440.26 100,000.00 - 104,999.99 1,309,068 146,439,175 92.57358 134,083,282,259.67 102,426.52 105,000.00 - 109,999.99 1,117,128 147,556,303 93.27979 120,020,513,136.11 107,436.67 110,000.00 - 114,999.99 977,055 148,533,358 93.89745 109,855,105,705.14 112,434.93 115,000.00 - 119,999.99 865,889 149,399,247 94.44483 101,693,061,676.62 117,443.53 120,000.00 - 124,999.99 773,339 150,172,586 94.93371 94,660,281,091.31 122,404.64 125,000.00 - 129,999.99 673,971 150,846,557 95.35977 85,886,152,964.93 127,433.01 130,000.00 - 134,999.99 595,827 151,442,384 95.73643 78,899,843,713.01 132,420.73 135,000.00 - 139,999.99 527,341 151,969,725 96.06980 72,476,546,845.30 137,437.72 140,000.00 - 144,999.99 466,992 152,436,717 96.36501 66,519,743,635.12 142,443.00 145,000.00 - 149,999.99 419,003 152,855,720 96.62989 61,787,674,520.19 147,463.56 150,000.00 - 154,999.99 384,581 153,240,301 96.87301 58,607,775,121.57 152,393.84 155,000.00 - 159,999.99 335,391 153,575,692 97.08503 52,801,735,517.69 157,433.37 160,000.00 - 164,999.99 296,048 153,871,740 97.27218 48,087,213,596.86 162,430.46 165,000.00 - 169,999.99 265,309 154,137,049 97.43990 44,426,198,104.69 167,450.78 170,000.00 - 174,999.99 239,515 154,376,564 97.59131 41,304,379,348.95 172,450.07 175,000.00 - 179,999.99 216,255 154,592,819 97.72802 38,370,042,895.27 177,429.62 180,000.00 - 184,999.99 200,592 154,793,411 97.85483 36,588,064,085.78 182,400.42 185,000.00 - 189,999.99 179,005 154,972,416 97.96799 33,554,727,208.93 187,451.34 190,000.00 - 194,999.99 165,277 155,137,693 98.07247 31,807,897,759.84 192,452.05 195,000.00 - 199,999.99 154,070 155,291,763 98.16987 30,425,466,536.83 197,478.20 200,000.00 - 249,999.99 1,039,897 156,331,660 98.82726 230,863,458,226.21 222,006.08 250,000.00 - 299,999.99 565,105 156,896,765 99.18450 153,945,762,663.99 272,419.75 300,000.00 - 349,999.99 333,584 157,230,349 99.39537 107,708,119,615.81 322,881.55 350,000.00 - 399,999.99 219,923 157,450,272 99.53440 82,117,070,706.61 373,390.10 400,000.00 - 449,999.99 151,162 157,601,434 99.62996 63,997,346,472.50 423,369.28 450,000.00 - 499,999.99 108,881 157,710,315 99.69879 51,583,042,398.64 473,756.14 500,000.00 - 999,999.99 345,935 158,056,250 99.91748 230,331,407,862.96 665,822.79 1,000,000.00 - 1,499,999.99 65,548 158,121,798 99.95892 78,672,933,288.58 1,200,233.92 1,500,000.00 - 1,999,999.99 24,140 158,145,938 99.97418 41,431,838,733.52 1,716,314.78 2,000,000.00 - 2,499,999.99 12,137 158,158,075 99.98185 26,997,226,154.27 2,224,373.91 2,500,000.00 - 2,999,999.99 6,871 158,164,946 99.98619 18,747,446,313.27 2,728,488.77 3,000,000.00 - 3,499,999.99 4,799 158,169,745 99.98923 15,507,304,422.66 3,231,361.62 3,500,000.00 - 3,999,999.99 3,258 158,173,003 99.99129 12,166,741,762.34 3,734,420.43 4,000,000.00 - 4,499,999.99 2,353 158,175,356 99.99277 9,970,953,222.98 4,237,549.18 4,500,000.00 - 4,999,999.99 1,822 158,177,178 99.99393 8,633,941,395.34 4,738,716.46 5,000,000.00 - 9,999,999.99 6,468 158,183,646 99.99802 43,887,775,808.42 6,785,370.41 10,000,000.00 - 19,999,999.99 2,230 158,185,876 99.99942 30,065,006,121.19 13,482,065.53 20,000,000.00 - 49,999,999.99 776 158,186,652 99.99992 22,450,911,983.01 28,931,587.61 50,000,000.00 and over 134 158,186,786 100.00000 11,564,829,969.82 86,304,701.27
skeleton
import pylab
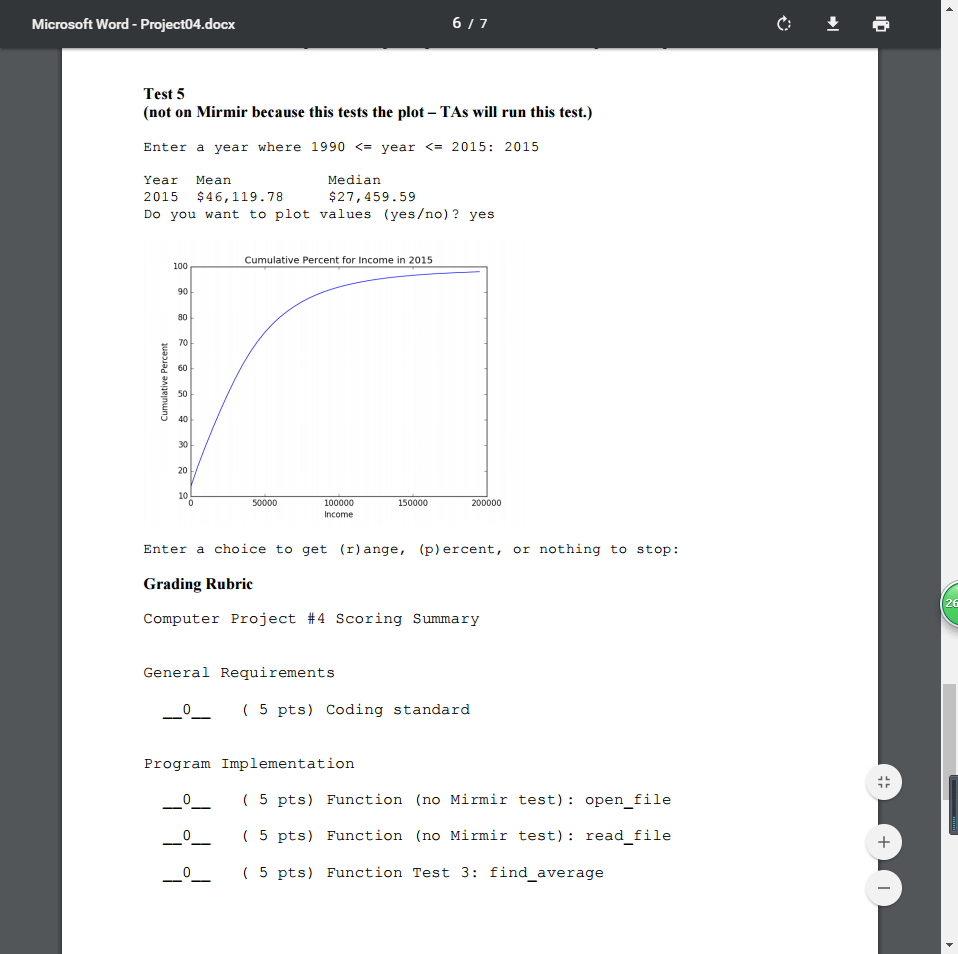
def do_plot(x_vals,y_vals,year): '''Plot x_vals vs. y_vals where each is a list of numbers of the same length.''' pylab.xlabel('Income') pylab.ylabel('Cumulative Percent') pylab.title("Cumulative Percent for Income in "+str(year)) pylab.plot(x_vals,y_vals) pylab.show() def open_file(): '''You fill in the doc string''' year_str = input("Enter a year where 1990
def get_percent(data_lst,salary): '''You fill in the doc string''' pass # replace this line with your code
def main(): # Insert code here to determine year, average, and median response = input("Do you want to plot values (yeso)? ") if response.lower() == 'yes': pass # replace this line # determine x_vals, a list of floats -- use the lowest 40 income ranges # determine y_vales, a list of floats of the same length as x_vals # do_plot(x_vals,y_vals,year) choice = input("Enter a choice to get (r)ange, (p)ercent, or nothing to stop: ") while choice: # Insert code here to handle choice choice = input("Enter a choice to get (r)ange, (p)ercent, or nothing to stop: ")
if __name__ == "__main__": main()
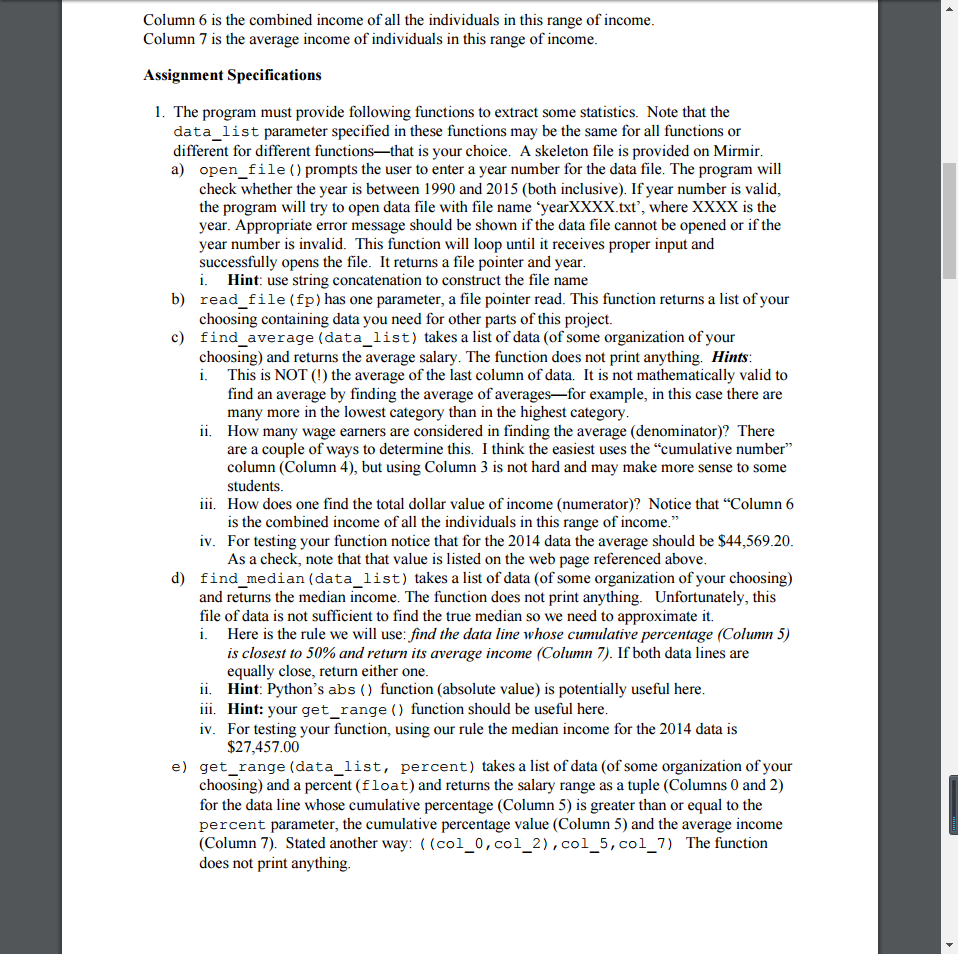
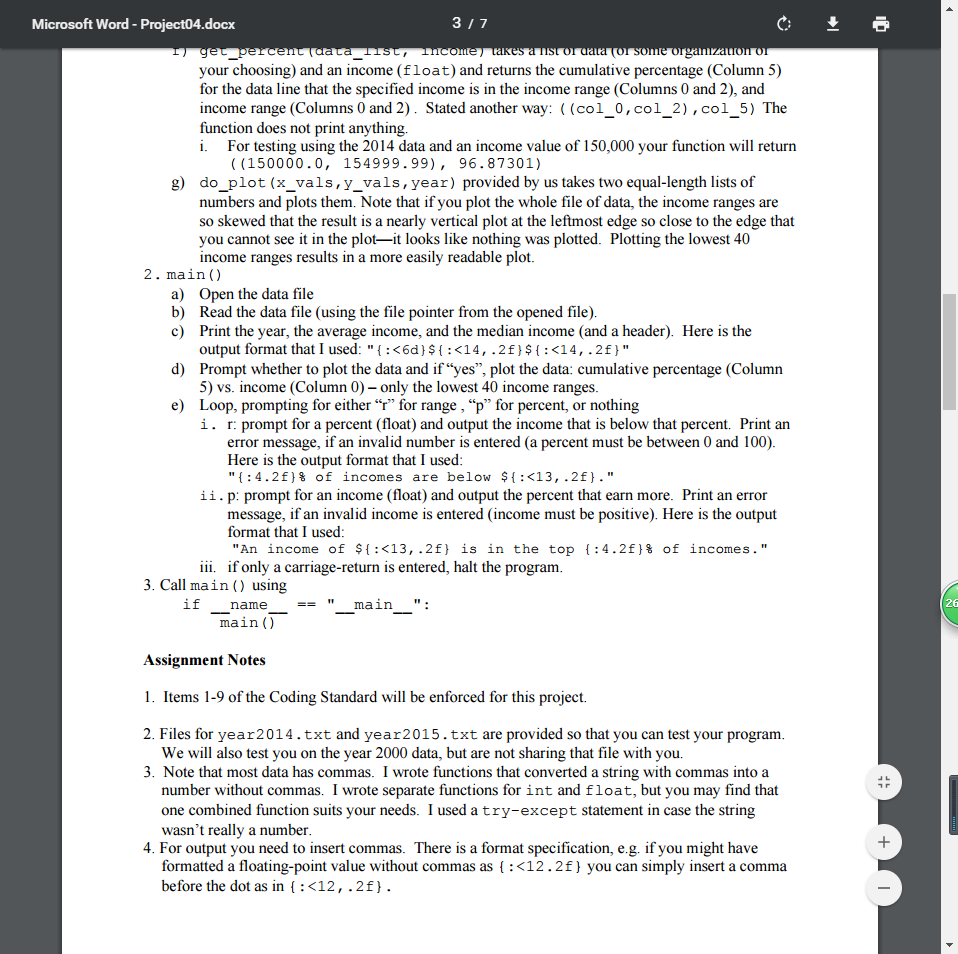
Summer 2017 CSE 231 Computer Project #4 (6/7/2017 Fixed TestA median) Assignment overview This assignment focuses on the implementation of Python programs to read files and process data by using lists and functions It is worth 85 points (8.5% of course grade) and must be completed no later than 11:59 PM on Monday, June 12 Assignment Deliverable The deliverable for this assignment is the following file proj04.py the source code for your Python program Be sure to use the specified file name and to submit it for grading via the Mirmir system before the project deadline Assignment Background One commonly hears reference to "the one percent" referring to the people whose income is in the top 1% of incomes. What is the data behind that number and where do others fall? Using the National Average Wage Index (AWI), an index used by the Social Security Administration to gauge a individual's earnings for the purpose of calculating their retirement benefit, we can answer such questions In this project, you will process AWI data. Example data for 2014 and 2015 is provided in the files year 2014. txt and year 2015. txt (2015 is the most recent year of complete data-the 2016 data isn't available until October) The data is a table with the first row as the title and the second row defining the data fields, remaining rows are data. Note that the 2014 data is nicely formatted in columns, but the 2015 data is not. The URL for the data is: https://www.ssa.gov/cgi- binetcom p.cgi ear-2015 Here is the second line of data from the file followed by descriptions of the data. Notice that some data are ints and some are floats: 5,000.00 9,999.99 13,948,841 36,4 281 23.025 49 102, 586, 913,092. 61 7, 407.62 423, Column 0 is bottom of this income range. Column 1 is the hyphen separating the bottom of the range from the top Column 2 is the top of this income range. Column 3 is the number of individuals in the income range. Column 4 is the cumulative number of individuals in this income range and all lower ranges Column 5 is the Column 4 value represented as a cumulative percentage of all individuals 26
Step by Step Solution
There are 3 Steps involved in it
Step: 1

Get Instant Access to Expert-Tailored Solutions
See step-by-step solutions with expert insights and AI powered tools for academic success
Step: 2

Step: 3

Ace Your Homework with AI
Get the answers you need in no time with our AI-driven, step-by-step assistance
Get Started


