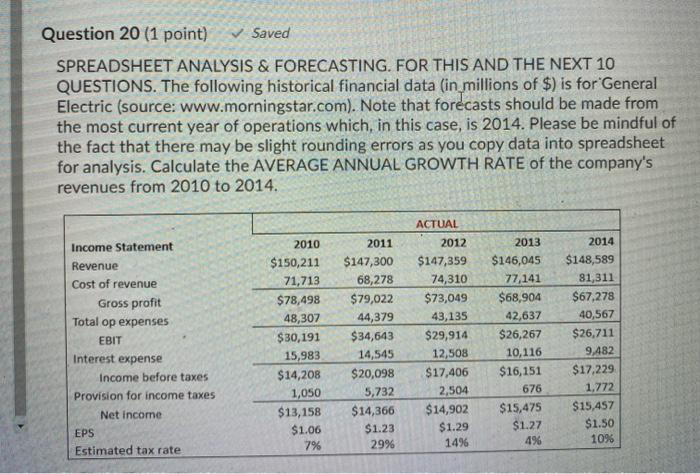
Use Question 20 to answer
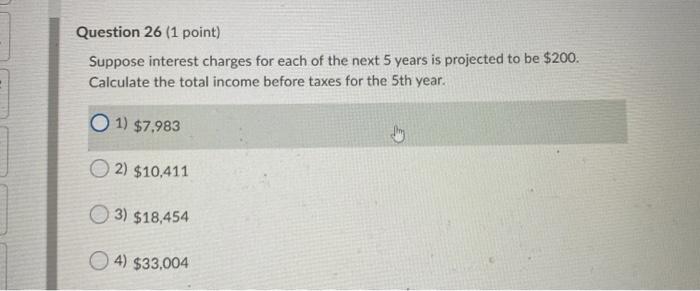
Question 26 (1 point) Suppose interest charges for each of the next 5 years is projected to be $200. Calculate the total income before taxes for the 5th year. O 1) $7,983 2) $10,411 3) $18,454 4) $33,004 Question 20 (1 point) Saved SPREADSHEET ANALYSIS & FORECASTING. FOR THIS AND THE NEXT 10 QUESTIONS. The following historical financial data (in millions of $) is for General Electric (source: www.morningstar.com). Note that forecasts should be made from the most current year of operations which, in this case, is 2014. Please be mindful of the fact that there may be slight rounding errors as you copy data into spreadsheet for analysis. Calculate the AVERAGE ANNUAL GROWTH RATE of the company's revenues from 2010 to 2014. 2011 Income Statement Revenue Cost of revenue Gross profit Total op expenses EBIT Interest expense Income before taxes Provision for income taxes Net income EPS Estimated tax rate 2010 $150,211 71,713 $78,498 48,307 $30,191 15,983 $14,208 1,050 $13,158 $1.06 7% $147,300 68,278 $79,022 44,379 $34,643 14,545 $20,098 5,732 $14,366 $1.23 2996 ACTUAL 2012 $147,359 74,310 $73,049 43,135 $29,914 12,508 $17,406 2,504 $14,902 $1.29 14% 2013 $146,045 77,141 $68,904 42,637 $26,267 10,116 $16,151 676 $15,475 $1.27 4% 2014 $148,589 81,311 $67,278 40,567 $26,711 9,482 $17,229 1,772 $15,457 $1.50 109 Question 26 (1 point) Suppose interest charges for each of the next 5 years is projected to be $200. Calculate the total income before taxes for the 5th year. O 1) $7,983 2) $10,411 3) $18,454 4) $33,004 Question 20 (1 point) Saved SPREADSHEET ANALYSIS & FORECASTING. FOR THIS AND THE NEXT 10 QUESTIONS. The following historical financial data (in millions of $) is for General Electric (source: www.morningstar.com). Note that forecasts should be made from the most current year of operations which, in this case, is 2014. Please be mindful of the fact that there may be slight rounding errors as you copy data into spreadsheet for analysis. Calculate the AVERAGE ANNUAL GROWTH RATE of the company's revenues from 2010 to 2014. 2011 Income Statement Revenue Cost of revenue Gross profit Total op expenses EBIT Interest expense Income before taxes Provision for income taxes Net income EPS Estimated tax rate 2010 $150,211 71,713 $78,498 48,307 $30,191 15,983 $14,208 1,050 $13,158 $1.06 7% $147,300 68,278 $79,022 44,379 $34,643 14,545 $20,098 5,732 $14,366 $1.23 2996 ACTUAL 2012 $147,359 74,310 $73,049 43,135 $29,914 12,508 $17,406 2,504 $14,902 $1.29 14% 2013 $146,045 77,141 $68,904 42,637 $26,267 10,116 $16,151 676 $15,475 $1.27 4% 2014 $148,589 81,311 $67,278 40,567 $26,711 9,482 $17,229 1,772 $15,457 $1.50 109