Answered step by step
Verified Expert Solution
Question
1 Approved Answer
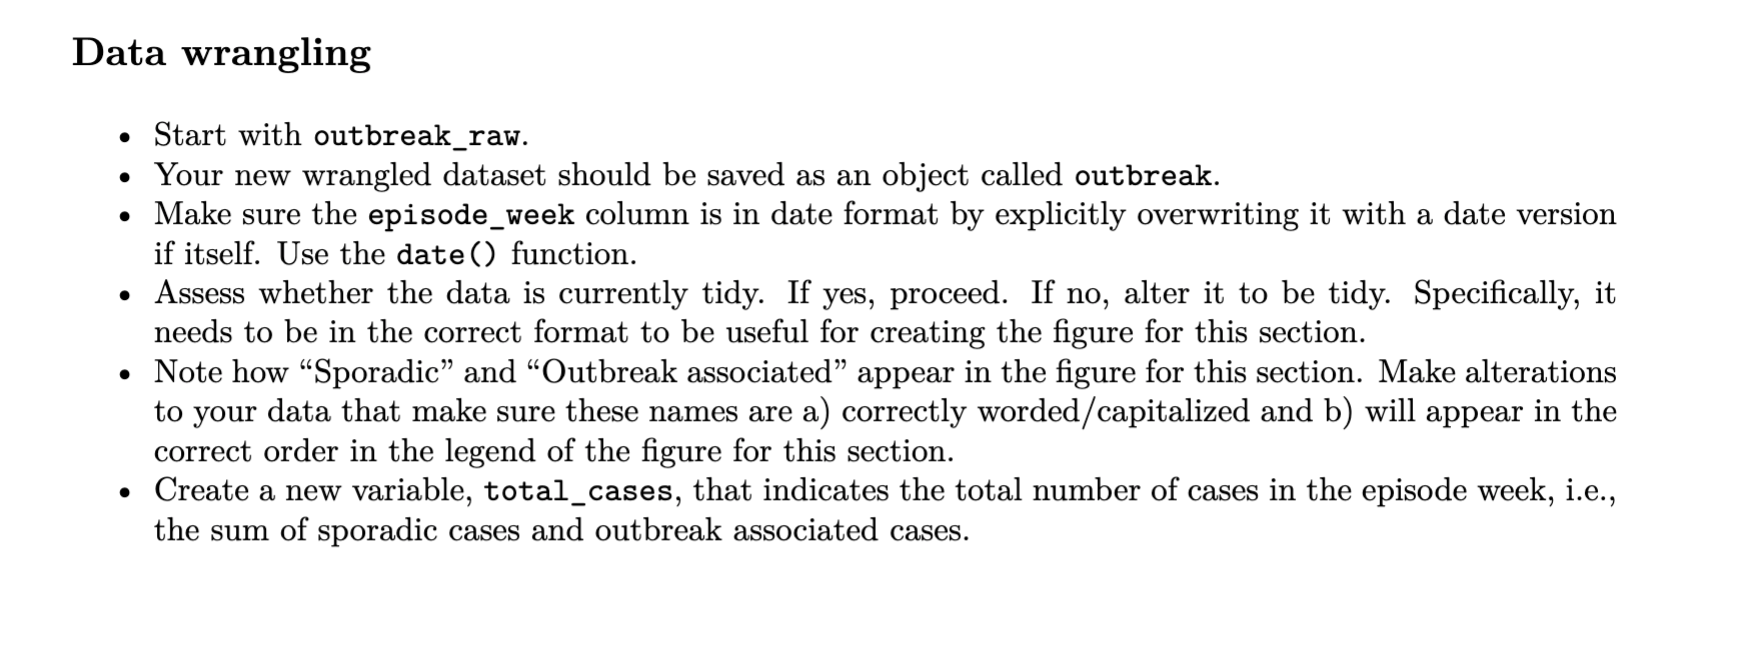
Use R language Data wrangling Start with outbreak_raw. Your new wrangled dataset should be saved as an object called outbreak. Make sure the episode_week column

Use R language
Data wrangling Start with outbreak_raw. Your new wrangled dataset should be saved as an object called outbreak. Make sure the episode_week column is in date format by explicitly overwriting it with a date version if itself. Use the date() function. Assess whether the data is currently tidy. If yes, proceed. If no, alter it to be tidy. Specifically, it needs to be in the correct format to be useful for creating the figure for this section. Note how Sporadic and Outbreak associated appear in the figure for this section. Make alterations to your data that make sure these names are a) correctly worded/capitalized and b) will appear in the correct order in the legend of the figure for this section. Create a new variable, total_cases, that indicates the total number of cases in the episode week, i.e., the sum of sporadic cases and outbreak associated cases. . Data wrangling Start with outbreak_raw. Your new wrangled dataset should be saved as an object called outbreak. Make sure the episode_week column is in date format by explicitly overwriting it with a date version if itself. Use the date() function. Assess whether the data is currently tidy. If yes, proceed. If no, alter it to be tidy. Specifically, it needs to be in the correct format to be useful for creating the figure for this section. Note how Sporadic and Outbreak associated appear in the figure for this section. Make alterations to your data that make sure these names are a) correctly worded/capitalized and b) will appear in the correct order in the legend of the figure for this section. Create a new variable, total_cases, that indicates the total number of cases in the episode week, i.e., the sum of sporadic cases and outbreak associated cases
Step by Step Solution
There are 3 Steps involved in it
Step: 1

Get Instant Access to Expert-Tailored Solutions
See step-by-step solutions with expert insights and AI powered tools for academic success
Step: 2

Step: 3

Ace Your Homework with AI
Get the answers you need in no time with our AI-driven, step-by-step assistance
Get Started


