

Answered step by step
Verified Expert Solution
Question
1 Approved Answer
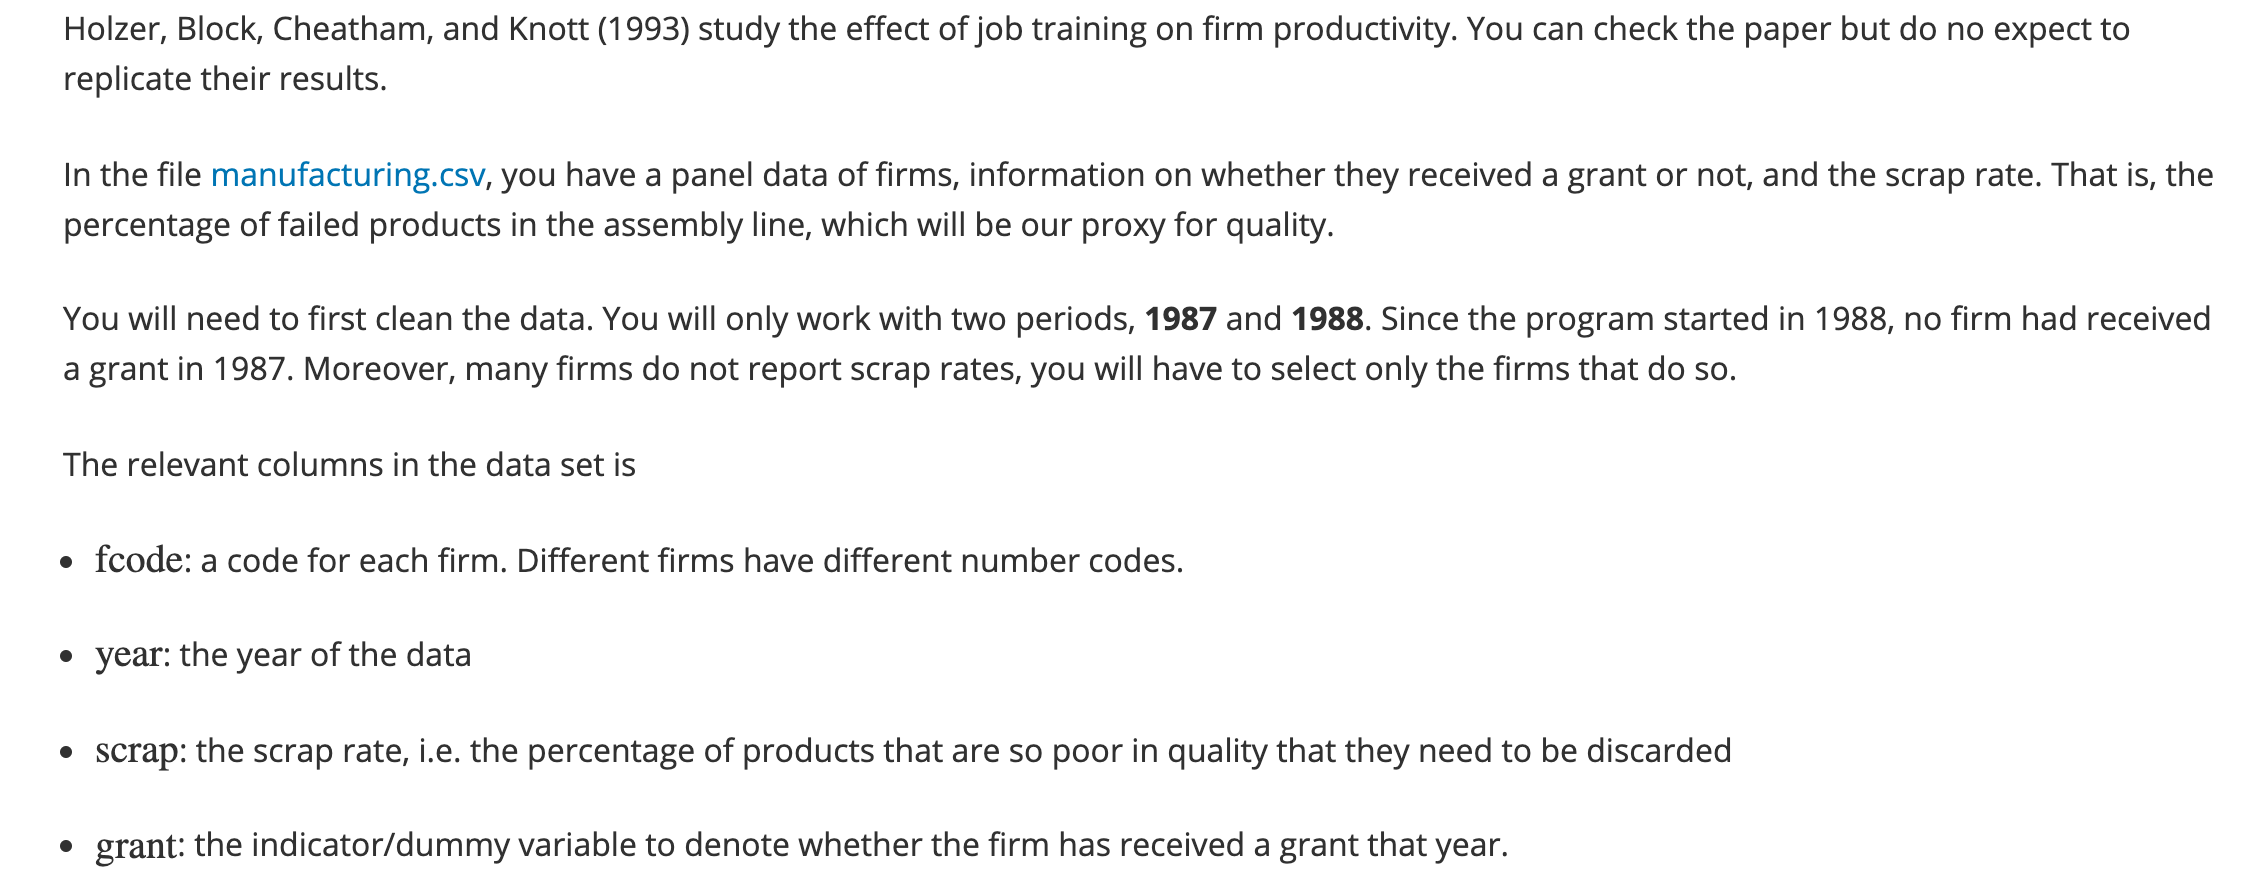
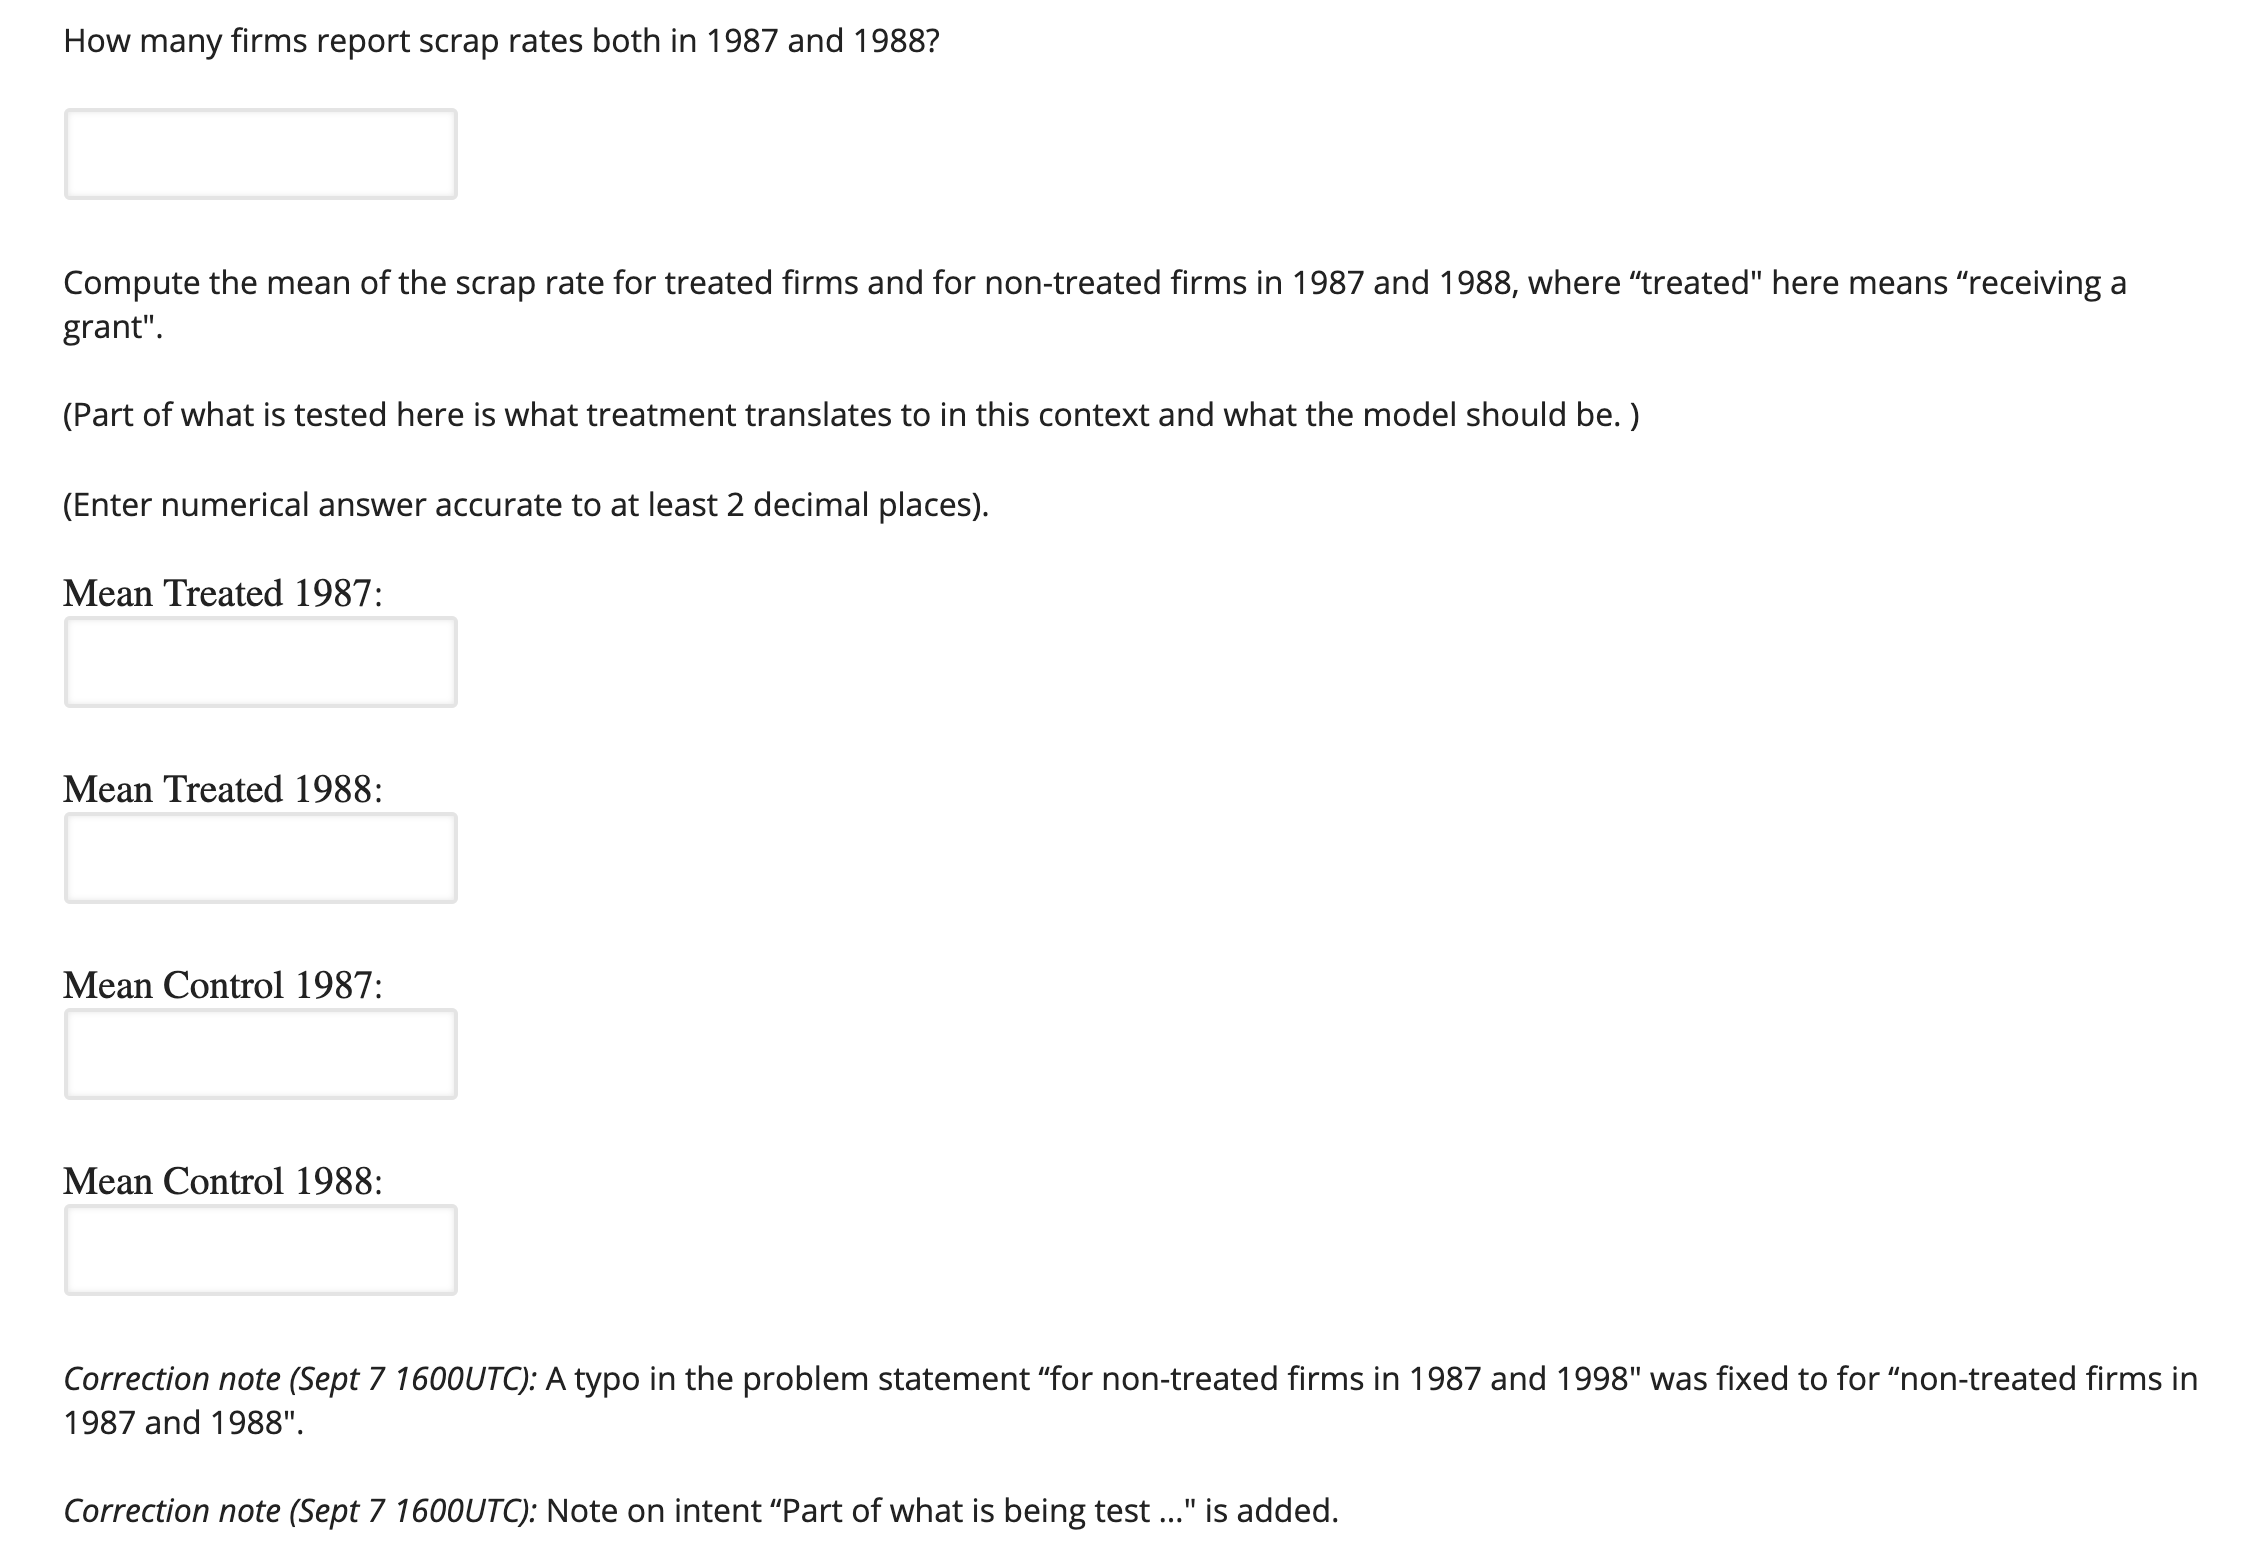
Use R to answer the questions of statistics and probability, the data is here: https://drive.google.com/file/d/1wiJGkqgLXBJMyFviI9tuBX4gfAzZ7OlV/view?usp=sharing Holzer, Block, Cheatham, and Knott (1993) study the effect ofjob
Use R to answer the questions of statistics and probability, the data is here:
https://drive.google.com/file/d/1wiJGkqgLXBJMyFviI9tuBX4gfAzZ7OlV/view?usp=sharing
Step by Step Solution
There are 3 Steps involved in it
Step: 1

Get Instant Access to Expert-Tailored Solutions
See step-by-step solutions with expert insights and AI powered tools for academic success
Step: 2

Step: 3
Ace Your Homework with AI
Get the answers you need in no time with our AI-driven, step-by-step assistance
Get Started
Linear Algebra A Modern Introduction
Authors: David Poole
3rd edition
9781133169574 , 978-0538735452