

Question
Use @RISK to draw a binomial distribution that results from 50 trials with probability of success 0.3 on each trial, and use it to answer
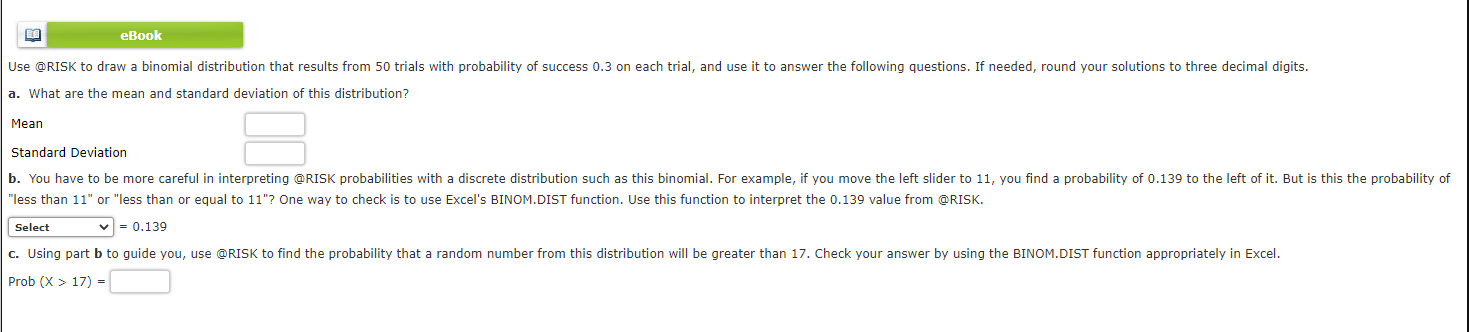
Use @RISK to draw a binomial distribution that results from 50 trials with probability of success 0.3 on each trial, and use it to answer the following questions. If needed, round your solutions to three decimal digits.
a. What are the mean and standard deviation of this distribution?
| Mean | |
| Standard Deviation |
b. You have to be more careful in interpreting @RISK probabilities with a discrete distribution such as this binomial. For example, if you move the left slider to 11, you find a probability of 0.139 to the left of it. But is this the probability of "less than 11" or "less than or equal to 11"? One way to check is to use Excel's BINOM.DIST function. Use this function to interpret the 0.139 value from @RISK.
SelectProb (X
c. Using part b to guide you, use @RISK to find the probability that a random number from this distribution will be greater than 17. Check your answer by using the BINOM.DIST function appropriately in Excel.
Prob (X > 17) =
Step by Step Solution
There are 3 Steps involved in it
Step: 1

Get Instant Access to Expert-Tailored Solutions
See step-by-step solutions with expert insights and AI powered tools for academic success
Step: 2

Step: 3
Ace Your Homework with AI
Get the answers you need in no time with our AI-driven, step-by-step assistance
Get Started
Geometry, Structure And Randomness In Combinatorics
Authors: Ji?í Matousek, Jaroslav Nešet?il, Marco Pellegrini
1st Edition
887642525X, 9788876425257