

Question
Use SENTENCING.XLS. A codebook with description of the data is on the last page of this document. Tasks to Complete: Produce a frequency table and
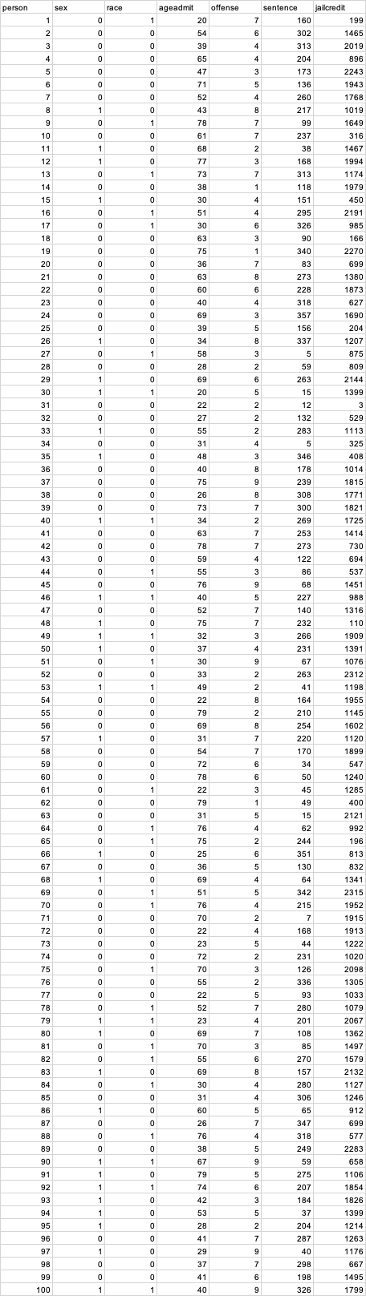
Use SENTENCING.XLS. A codebook with description of the data is on the last page of this document.
Tasks to Complete:
- Produce a frequency table and a pie chart for RACE. Summarize the results. (Note that 0 = White and 1= Black).
- Produce the mode, median, mean,standard deviation, variance, range, minimum, and maximum for JAILCREDIT and AGEADMIT.Report the results.
- Construct a 95% confidence interval around the sample mean of JAILCREDIT and AGEADMIT, respectively. Interpret and summarize your results.
- Assume that the average age ofoffenders at prison admissions in the state of Florida is 30. Use the data to perform a hypothesis test to determine if the average age of offenders at prison admissions in your sample is significantly different from the average age in the offender population in Florida. The variable that measures the average age of offenders at prison admission is AGEADMIT. Use a .05 level of statistical significance. Run the one-sample t-test inExcel. In your summary, please discuss the null hypothesis, alternative hypothesis, the result of this hypothesis test, and interpret the result.
- Assume that the average length ofjail in pretrial in the state of Florida is 90 days. Use the data to perform a hypothesis test to determine if the average length of jail in pretrial in your sample is significantly different from the average length of jail in pretrial in Florida. The variable that measures the average length of jail in pretrial is JAILCREDIT. Use a .05 level of statistical significance. Run the one-sample t-test inExcel. In your summary, please discuss the null hypothesis, alternative hypothesis, the result of this hypothesis test, and interpret the result.
- Conduct an independent sample t-test (alpha= .05) inExcel to determine whether there is a significant difference in the length of jail in pretrial between White and Black offenders. For this t-test, assume that the variances of the two groups are unequal. In your summary, please discuss the null hypothesis, alternative hypothesis, the result of this hypothesis test, and interpret the result.
- Conduct an independent sample t-test (alpha= .05) inExcel to determine whether there is a significant difference in the age of offenders at prison admissions between White and Black offenders. For this t-test, assume that the variances of the two groups are equal. In your summary, please discuss the null hypothesis, alternative hypothesis, the result of this hypothesis test, and interpret the result.
- Conduct a Chi-Square test inExcel to determine if the race of offenders is independent of offense type.In your summary, please discuss the null hypothesis, alternative hypothesis, the result of this hypothesis test, and interpret the result.
- Conduct an ANOVA test inExcel to determine if there is a significant difference in JAILCREDIT across offense types.In your summary, please discuss the null hypothesis, alternative hypothesis, the result of this hypothesis test, and interpret the result.
- CorrelateAGEADMIT and JAILCREDIT inExcel. Summarize your results and make sure that you briefly explain what this correlation means to you in terms of the impact of age on the length of jail in pretrial (direction of the correlation, correlation coefficient, and test of significance result).
| Variable Name | Type of Variable | Variable Label | Value Labels | Values Explanation |
| County | Character | County of Sentence | NA | Literal name of county |
| Sex | Character | Sex of Offender | NA | Literal name of sex-Male, Female |
| Race | Character | Race of Offender | NA | Literal name of race-White, Black, Chinese, Nat. Amer. Hispanic, All Others, Unknown |
| Sentence | Numeric | Length of Sentence in Months | NA | Sentence length in months, except 9999998 = Life, 9999999 = Death |
| Offense | Numeric | Primary Offense | 1 = Murder | |
| 2 = Sex Offense | ||||
| 3 = Robbery | ||||
| 4 = Other Violent | ||||
| 5 = Burglary | ||||
| 6 = Property | ||||
| 7 = Drugs | ||||
| 8 = Weapons | ||||
| 9 = Other Crimes | ||||
| JailCredit | Numeric | Length in Jail Pretrial | NA | In Days |
| AgeAdmit | Numeric | Age of Offender at Prison Admissions | NA | In Years |
What your data should look like (the first few rows only)
| COUNTY | SEX | RACE | SENTENCE | OFFENSE | JAILCREDIT | AGEADMIT |
| LEE | MALE | WHITE | 300 | 2 | 388 | 65 |
| PALM BEACH | MALE | BLACK | 39 | 7 | 272 | 61 |
| BROWARD | MALE | BLACK | 12 | 5 | 75 | 59 |
| POLK | MALE | WHITE | 36 | 4 | 224 | 71 |
| HILLSBOROUGH | MALE | BLACK | 120 | 2 | 225 | 59 |
| DADE | MALE | BLACK | 20 | 4 | 135 | 66 |
| BROWARD | MALE | BLACK | 17 | 7 | 53 | 56 |
| ESCAMBIA | MALE | BLACK | 36 | 7 | 90 | 58 |
Step by Step Solution
There are 3 Steps involved in it
Step: 1

Get Instant Access to Expert-Tailored Solutions
See step-by-step solutions with expert insights and AI powered tools for academic success
Step: 2

Step: 3
Ace Your Homework with AI
Get the answers you need in no time with our AI-driven, step-by-step assistance
Get Started
Linear Algebra With Applications
Authors: W. Keith Nicholson
7th Edition
978-0070985100, 70985103