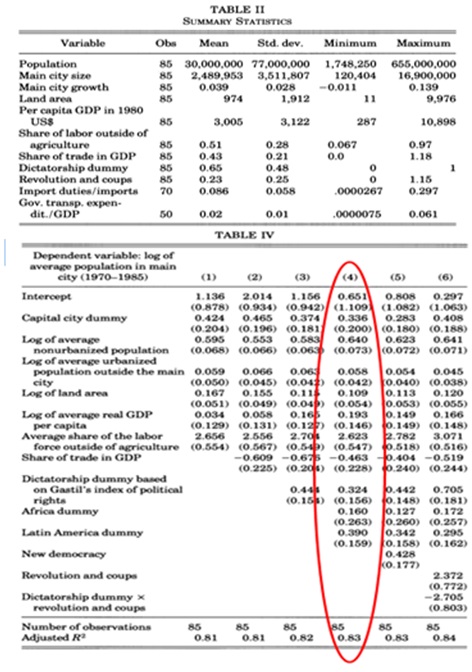
Use Table 2 and equation (4) in Table IV
(Hint. All other variables have mean values, for example its population is
30,000,000, main city size is 2,489,953, land area is 974, etc.)
TABLE II SUMMARY STATISTICS Variable Obs Mean Std. dev. Minimum Maximum Population 30,000.000 77.000.000 1,748,250 656,000.000 Main city size 2,489.953 3,511.807 120.404 16,900.000 Main city growth 0.039 0.028 -0.011 0.139 Land area 85 974 1.912 11 9.976 Per capita GDP in 1980 USS 3,005 3,122 287 10.898 Share of labor outside of agriculture 0.51 0.28 0.067 0.97 Share of trade in GDP 0.43 0.21 0.0 1.18 Dictatorship dummy 0.65 0.48 Revolution and coups 0.23 0.25 1.15 Import duties/imports 70 0.086 0.058 0000267 0.297 Gov, transp. expen- dit /GDP 50 0.02 0.01 0000075 0.061 TABLE IV Dependent variable: log of average population in main city (1970-1985) (D) (2) (3) (5) (6) Intercept 1.136 2.014 1.156 0.651 0.297 (0.878) (0.934) (0.942) (1.109 (1.082) (1.063) Capital city dummy 0.424 0.465 0.374 0.336 0.283 0.408 (0.201) (0.196) (0.181 (0.200) (0. 180) (0.186) Log of average 0.595 0.553 0.583 0.610 0.623 0.641 nonurbanized population (0.068) (0.066) (0.063 (0.073) (0.072) (0.071) Log of average urbanized population outside the main 0.059 0.066 0.06 0.058 0.05-4 0.045 city (0.050) (0.045) (0.04]) (0.042) 0.040) (0.038) Log of land area 0.167 0.155 0.11 0.109 0.113 0.120 (0.051) (0.049) (0.01) (0.054) 0.053) (0.055) Log of average real GDP 0.034 0.058 0.16 0.193 0.149 0.166 per capita (0.129) (0.131) (0. 12 3 (0.146) 0.149) (0.148) Average share of the labor 2.656 2.556 2.701 2.623 2.782 3.071 force outside of agriculture (0.550) (0567) (0.54)) (0.547) 0.518) (0.516) Share of trade in GDP -0.609 -0.675 -0.463 0.404 -0.619 (0.225) (0.201) (0 228) (0.240) (0.244) Dictatorship dummy based on Gastil's index of political 0.441 0.324 0.442 0.705 rights (0.15 )) (0.156) 0.148) (0. 181) Africa dummy 0.160 0.127 0.172 (0.263) 0.260) (0.257) Latin America dummy 0.390 0.342 0.295 (0.159) 0.158) (0.162) New democracy 0.428 (0.177) Revolution and coups 2.372 (0.772) Dictatorship dummy x -2.705 revolution and coups (0.803) Number of observations 85 85 85 Adjusted Ri 0.81 0.81 0.82 0.63 0.83 0.84