

Question
Use the above information from the tables to work out the following missing entries, and then calculate the companys return on equity. Note: Turnover and
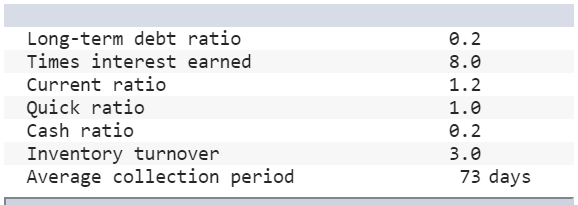
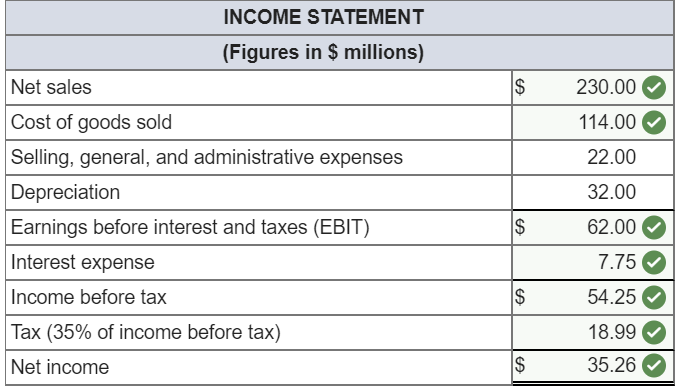
Use the above information from the tables to work out the following missing entries, and then calculate the companys return on equity. Note: Turnover and the average collection period are calculated using start-of-year, not average, values. (Enter your answers in millions. Round intermediate calculations and final answers to 2 decimal places.)
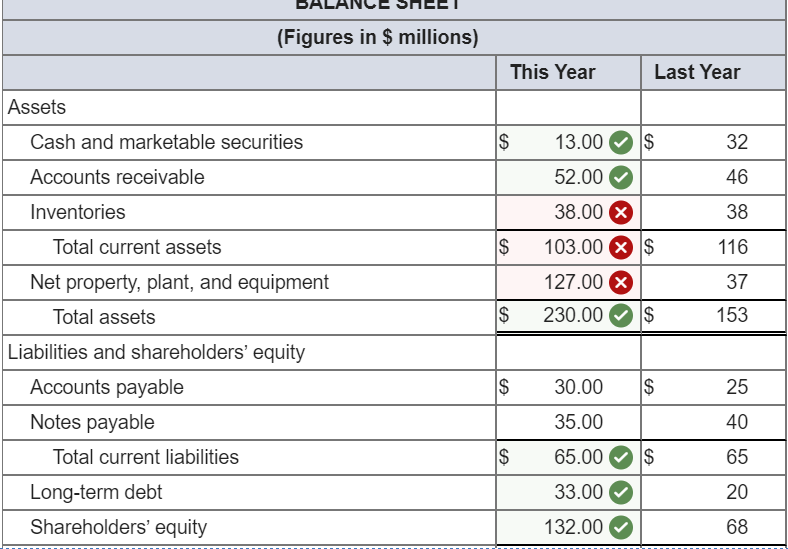

The "Total liabilities and shareholders' equity" is part of the Balance Sheet. Please correct the incorrect answers in red. Thank you.
Long-term debt ratio Times interest earned Current ratio Quick ratio Cash ratio Inventory turnover Average collection period 0.2 8.0 1.2 1.0 0.2 3.0 73 days INCOME STATEMENT (Figures in $ millions) Net sales $ 230.00 114.00 22.00 32.00 $ 62.00 Cost of goods sold Selling, general, and administrative expenses Depreciation Earnings before interest and taxes (EBIT) Interest expense Income before tax Tax (35% of income before tax) Net income 7.75 $ 54.25 18.99 $ 35.26 (Figures in $ millions) This Year Last Year Assets $ 32 Cash and marketable securities Accounts receivable 13.00 $ 52.00 46 Inventories 38.00 X 38 $ 103.00 X $ 116 127.00 X 37 $ 230.00 $ 153 Total current assets Net property, plant, and equipment Total assets Liabilities and shareholders' equity Accounts payable Notes payable Total current liabilities Long-term debt Shareholders' equity $ 30.00 $ 25 35.00 40 $ 65.00$ 65 33.00 20 132.00 68 Total liabilities and shareholders' equity $ 230.00 $ 153 Long-term debt ratio Times interest earned Current ratio Quick ratio Cash ratio Inventory turnover Average collection period 0.2 8.0 1.2 1.0 0.2 3.0 73 days INCOME STATEMENT (Figures in $ millions) Net sales $ 230.00 114.00 22.00 32.00 $ 62.00 Cost of goods sold Selling, general, and administrative expenses Depreciation Earnings before interest and taxes (EBIT) Interest expense Income before tax Tax (35% of income before tax) Net income 7.75 $ 54.25 18.99 $ 35.26 (Figures in $ millions) This Year Last Year Assets $ 32 Cash and marketable securities Accounts receivable 13.00 $ 52.00 46 Inventories 38.00 X 38 $ 103.00 X $ 116 127.00 X 37 $ 230.00 $ 153 Total current assets Net property, plant, and equipment Total assets Liabilities and shareholders' equity Accounts payable Notes payable Total current liabilities Long-term debt Shareholders' equity $ 30.00 $ 25 35.00 40 $ 65.00$ 65 33.00 20 132.00 68 Total liabilities and shareholders' equity $ 230.00 $ 153Step by Step Solution
There are 3 Steps involved in it
Step: 1

Get Instant Access to Expert-Tailored Solutions
See step-by-step solutions with expert insights and AI powered tools for academic success
Step: 2

Step: 3
Ace Your Homework with AI
Get the answers you need in no time with our AI-driven, step-by-step assistance
Get Started
The School Fundraising Handbook
Authors: Lindsey Marsh
1st Edition
1785834266, 978-1785834264