Answered step by step
Verified Expert Solution
Question
1 Approved Answer
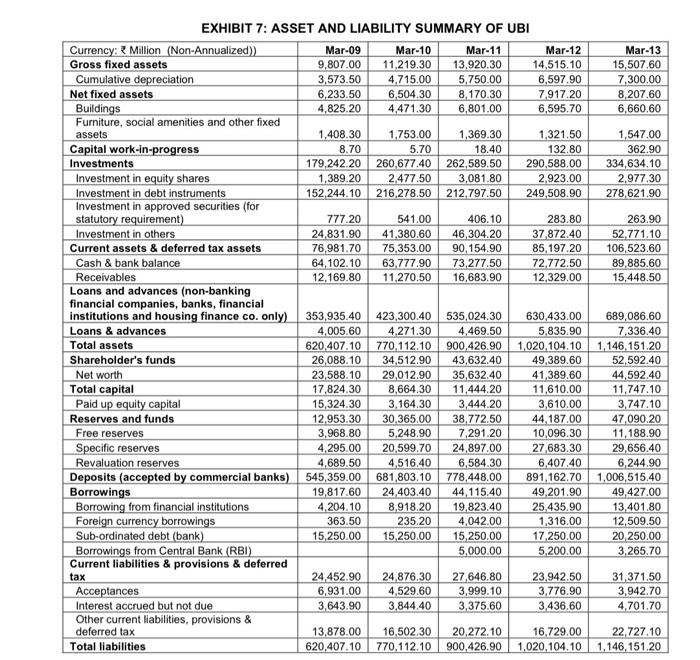
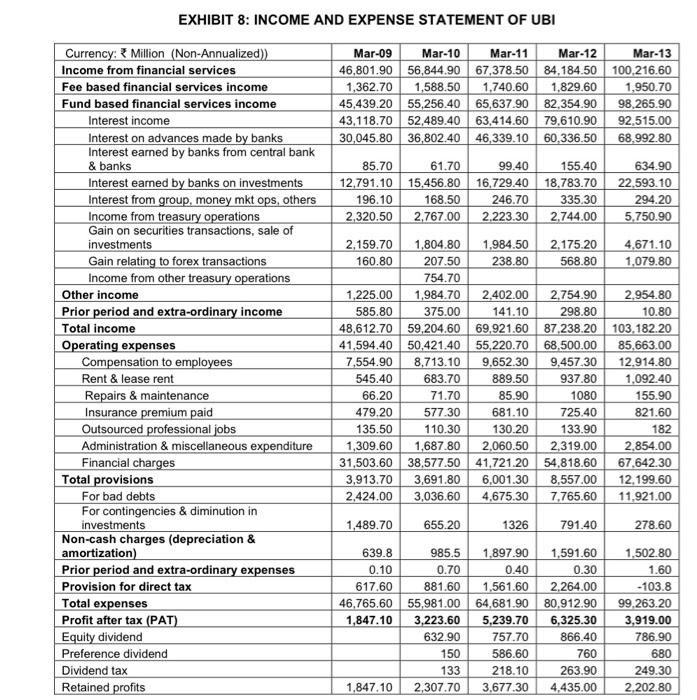
use the above ratios to evaluate UBI EXHIBIT 7: ASSET AND LIABILITY SUMMARY OF UBI Currency: Million (Non-Annualized)) Mar-09 Mar-10 Mar-11 Mar-12 Mar-13 Gross fixed


use the above ratios to evaluate UBI
EXHIBIT 7: ASSET AND LIABILITY SUMMARY OF UBI Currency: Million (Non-Annualized)) Mar-09 Mar-10 Mar-11 Mar-12 Mar-13 Gross fixed assets 9,807.00 11,219.30 13,920.30 14,515.10 15,507.60 Cumulative depreciation 3,573.50 4,715,00 5,750.00 6,597.90 7,300.00 Net fixed assets 6,233.50 6,504.30 8.170.30 7,917.20 8,207.60 Buildings 4,825.20 4,471.30 6,801.00 6,595.70 6,660.60 Furniture, social amenities and other fixed assets 1.408.30 1.753.00 1,369.30 1,321.50 1,547.00 Capital work-in-progress 8.70 5.70 18.40 132.80 362.90 Investments 179,242.20 260,677.40 262,589.50 290,588.00 334,634.10 Investment in equity shares 1,389.20 2,477.50 3,081.80 2.923.00 2,977.30 Investment in debt instruments 152,244.10 216,278.50 212,797.50 249,508.90 278,621.90 Investment in approved securities (for statutory requirement) 777.20 541.00 406.10 283.80 263.90 Investment in others 24,831.90 41,380.60 46,304.20 37,872.40 52.771.10 Current assets & deferred tax assets 76,981.70 75,353.00 90,154.90 85,197.20 106,523.60 Cash & bank balance 64,102.10 63.777.90 73,277.50 72,772.50 89,885.60 Receivables 12,169.80 11,270.50 16,683.90 12,329.00 15,448.50 Loans and advances (non-banking financial companies, banks, financial institutions and housing finance co only) 353,935.40 423,300.40 535,024.30 630,433.00 689,086.60 Loans & advances 4,005,60 4.271.30 4,469.50 5,835.90 7,336.40 Total assets 620,407.10 770.112.10 900,426.90 1,020,104.10 1,146, 151.20 Shareholder's funds 26,088.10 34,512.90 43,632.40 49,389.60 52,592.40 Net worth 23,588.10 29,012.90 35,632.40 41,389.60 44,592.40 Total capital 17,824.30 8,664.30 11,444.20 11,610.00 11,747.10 Paid up equity capital 15,324.30 3.164.30 3,444.20 3,610.00 3,747.10 Reserves and funds 12.953.30 30,365.00 38,772.50 44,187.00 47,090.20 Free reserves 3,968.80 5,248.90 7,291.20 10,096.30 11,188.90 Specific reserves 4.295.00 20,599.70 24,897.00 27,683.30 29,656.40 Revaluation reserves 4,689.50 4,516.40 6,584.30 6,407.40 6,244.90 Deposits (accepted by commercial banks) 545,359.00 681,803.10 778,448.00 891,162.70 1,006,515.40 Borrowings 19,817.60 24.403.40 44,115.40 49,201.90 49,427.00 Borrowing from financial institutions 4,204.10 8,918.20 19,823.40 25,435.90 13,401.80 Foreign currency borrowings 363.50 235.20 4,042.00 1,316.00 12,509.50 Sub-ordinated debt (bank) 15,250.00 15,250.00 15,250.00 17.250.00 20,250.00 Borrowings from Central Bank (RBI) 5,000.00 5,200.00 3,265.70 Current liabilities & provisions & deferred tax 24,452.90 24,876.30 27,646.80 23,942,50 31,371.50 Acceptances 6,931.00 4,529.60 3,999.10 3,776.90 3,942.70 Interest accrued but not due 3,643.90 3.844.40 3,375.60 3,436.60 4.701.70 Other current liabilities, provisions & deferred tax 13,878.00 16,502.30 20,272.10 16,729.00 22.727.10 Total liabilities 620,407.10 770.112.10 900,426.90 1,020,104,10 1,146,151.20 EXHIBIT 8: INCOME AND EXPENSE STATEMENT OF UBI Mar-09 Mar-10 Mar-11 Mar-12 Mar-13 46,801.90 56,844.90 67,378.50 84,184.50 100.216.60 1,362.70 1,588.50 1.740.60 1,829.60 1,950.70 45,439.20 55,256.40 65,637.90 82,354.90 98,265.90 43,118.70 52,489.40 63,414.60 79,610.90 92,515.00 30,045.80 36,802.40 46,339.10 60,336.50 68,992.80 85.70 61.70 99.40 12,791.10 15,456.80 16,729.40 196.10 168.50 246.70 2.320.50 2,767.00 2.223.30 155.40 18.783.70 335.30 2.744.00 634.90 22,593.10 294.20 5.750.90 Currency: Million (Non-Annualized)) Income from financial services Fee based financial services income Fund based financial services income Interest income Interest on advances made by banks Interest earned by banks from central bank & banks Interest earned by banks on investments Interest from group, money mkt ops, others Income from treasury operations Gain on securities transactions, sale of investments Gain relating to forex transactions Income from other treasury operations Other income Prior period and extra-ordinary income Total income Operating expenses Compensation to employees Rent & lease rent Repairs & maintenance Insurance premium paid Outsourced professional jobs Administration & miscellaneous expenditure Financial charges Total provisions For bad debts For contingencies & diminution in investments Non-cash charges (depreciation & amortization) Prior period and extra-ordinary expenses Provision for direct tax Total expenses Profit after tax (PAT) Equity dividend Preference dividend Dividend tax Retained profits 2.159.70 1,804.80 1.984.50 2.175.20 4.671.10 160.80 207.50 238.80 568.80 1,079.80 754.70 1,225.00 1,984.70 2.402.00 2,754.90 2.954.80 585.80 375.00 141.10 298.80 10.80 48.612.70 59,204.60 69.921.60 87,238.20 103.182.20 41,594.40 50,421.40 55,220.70 68,500.00 85,663.00 7,554.90 8,713.10 9,652.30 9,457,30 12.914.80 545.40 683.70 889.50 937.80 1,092.40 66.20 71.70 85.90 1080 155.90 479.20 577.30 681.10 725.40 821.60 135.50 110.30 130.20 133.90 182 1,309.60 1,687.80 2,060.50 2.319.00 2,854.00 31,503.60 38,577.50 41,721.20 54,818.60 67.642.30 3,913.70 3,691.80 6,001.30 8,557.00 12.199.60 2.424.00 3,036.60 4,675.30 7,765.60 11,921.00 1,489.70 655.20 1326 791.40 278.60 639.8 985.5 1,897.90 1,591.60 0.10 0.70 0.40 0.30 617.60 881.60 1,561.60 2,264.00 46,765.60 55,981.00 64,681.90 80,912.90 1,847.10 3,223.60 5,239.70 6,325.30 632.90 757.70 866.40 150 586.60 760 133 218.10 263.90 1,847.10 2,307.70 3.677.30 4,435.00 1,502.80 1.60 -103.8 99.263.20 3,919.00 786.90 680 249.30 2.202.80 Using these statements, calculate the following performance measures: ROE Asset utilization ROA Equity multiplier Net interest margin Tax management efficiency Net noninterest margin Expense control efficiency Net operating margin Asset management efficiency Earnings spread Funds management efficiency Net profit margin Operating efficiency ratio EXHIBIT 7: ASSET AND LIABILITY SUMMARY OF UBI Currency: Million (Non-Annualized)) Mar-09 Mar-10 Mar-11 Mar-12 Mar-13 Gross fixed assets 9,807.00 11,219.30 13,920.30 14,515.10 15,507.60 Cumulative depreciation 3,573.50 4,715,00 5,750.00 6,597.90 7,300.00 Net fixed assets 6,233.50 6,504.30 8.170.30 7,917.20 8,207.60 Buildings 4,825.20 4,471.30 6,801.00 6,595.70 6,660.60 Furniture, social amenities and other fixed assets 1.408.30 1.753.00 1,369.30 1,321.50 1,547.00 Capital work-in-progress 8.70 5.70 18.40 132.80 362.90 Investments 179,242.20 260,677.40 262,589.50 290,588.00 334,634.10 Investment in equity shares 1,389.20 2,477.50 3,081.80 2.923.00 2,977.30 Investment in debt instruments 152,244.10 216,278.50 212,797.50 249,508.90 278,621.90 Investment in approved securities (for statutory requirement) 777.20 541.00 406.10 283.80 263.90 Investment in others 24,831.90 41,380.60 46,304.20 37,872.40 52.771.10 Current assets & deferred tax assets 76,981.70 75,353.00 90,154.90 85,197.20 106,523.60 Cash & bank balance 64,102.10 63.777.90 73,277.50 72,772.50 89,885.60 Receivables 12,169.80 11,270.50 16,683.90 12,329.00 15,448.50 Loans and advances (non-banking financial companies, banks, financial institutions and housing finance co only) 353,935.40 423,300.40 535,024.30 630,433.00 689,086.60 Loans & advances 4,005,60 4.271.30 4,469.50 5,835.90 7,336.40 Total assets 620,407.10 770.112.10 900,426.90 1,020,104.10 1,146, 151.20 Shareholder's funds 26,088.10 34,512.90 43,632.40 49,389.60 52,592.40 Net worth 23,588.10 29,012.90 35,632.40 41,389.60 44,592.40 Total capital 17,824.30 8,664.30 11,444.20 11,610.00 11,747.10 Paid up equity capital 15,324.30 3.164.30 3,444.20 3,610.00 3,747.10 Reserves and funds 12.953.30 30,365.00 38,772.50 44,187.00 47,090.20 Free reserves 3,968.80 5,248.90 7,291.20 10,096.30 11,188.90 Specific reserves 4.295.00 20,599.70 24,897.00 27,683.30 29,656.40 Revaluation reserves 4,689.50 4,516.40 6,584.30 6,407.40 6,244.90 Deposits (accepted by commercial banks) 545,359.00 681,803.10 778,448.00 891,162.70 1,006,515.40 Borrowings 19,817.60 24.403.40 44,115.40 49,201.90 49,427.00 Borrowing from financial institutions 4,204.10 8,918.20 19,823.40 25,435.90 13,401.80 Foreign currency borrowings 363.50 235.20 4,042.00 1,316.00 12,509.50 Sub-ordinated debt (bank) 15,250.00 15,250.00 15,250.00 17.250.00 20,250.00 Borrowings from Central Bank (RBI) 5,000.00 5,200.00 3,265.70 Current liabilities & provisions & deferred tax 24,452.90 24,876.30 27,646.80 23,942,50 31,371.50 Acceptances 6,931.00 4,529.60 3,999.10 3,776.90 3,942.70 Interest accrued but not due 3,643.90 3.844.40 3,375.60 3,436.60 4.701.70 Other current liabilities, provisions & deferred tax 13,878.00 16,502.30 20,272.10 16,729.00 22.727.10 Total liabilities 620,407.10 770.112.10 900,426.90 1,020,104,10 1,146,151.20 EXHIBIT 8: INCOME AND EXPENSE STATEMENT OF UBI Mar-09 Mar-10 Mar-11 Mar-12 Mar-13 46,801.90 56,844.90 67,378.50 84,184.50 100.216.60 1,362.70 1,588.50 1.740.60 1,829.60 1,950.70 45,439.20 55,256.40 65,637.90 82,354.90 98,265.90 43,118.70 52,489.40 63,414.60 79,610.90 92,515.00 30,045.80 36,802.40 46,339.10 60,336.50 68,992.80 85.70 61.70 99.40 12,791.10 15,456.80 16,729.40 196.10 168.50 246.70 2.320.50 2,767.00 2.223.30 155.40 18.783.70 335.30 2.744.00 634.90 22,593.10 294.20 5.750.90 Currency: Million (Non-Annualized)) Income from financial services Fee based financial services income Fund based financial services income Interest income Interest on advances made by banks Interest earned by banks from central bank & banks Interest earned by banks on investments Interest from group, money mkt ops, others Income from treasury operations Gain on securities transactions, sale of investments Gain relating to forex transactions Income from other treasury operations Other income Prior period and extra-ordinary income Total income Operating expenses Compensation to employees Rent & lease rent Repairs & maintenance Insurance premium paid Outsourced professional jobs Administration & miscellaneous expenditure Financial charges Total provisions For bad debts For contingencies & diminution in investments Non-cash charges (depreciation & amortization) Prior period and extra-ordinary expenses Provision for direct tax Total expenses Profit after tax (PAT) Equity dividend Preference dividend Dividend tax Retained profits 2.159.70 1,804.80 1.984.50 2.175.20 4.671.10 160.80 207.50 238.80 568.80 1,079.80 754.70 1,225.00 1,984.70 2.402.00 2,754.90 2.954.80 585.80 375.00 141.10 298.80 10.80 48.612.70 59,204.60 69.921.60 87,238.20 103.182.20 41,594.40 50,421.40 55,220.70 68,500.00 85,663.00 7,554.90 8,713.10 9,652.30 9,457,30 12.914.80 545.40 683.70 889.50 937.80 1,092.40 66.20 71.70 85.90 1080 155.90 479.20 577.30 681.10 725.40 821.60 135.50 110.30 130.20 133.90 182 1,309.60 1,687.80 2,060.50 2.319.00 2,854.00 31,503.60 38,577.50 41,721.20 54,818.60 67.642.30 3,913.70 3,691.80 6,001.30 8,557.00 12.199.60 2.424.00 3,036.60 4,675.30 7,765.60 11,921.00 1,489.70 655.20 1326 791.40 278.60 639.8 985.5 1,897.90 1,591.60 0.10 0.70 0.40 0.30 617.60 881.60 1,561.60 2,264.00 46,765.60 55,981.00 64,681.90 80,912.90 1,847.10 3,223.60 5,239.70 6,325.30 632.90 757.70 866.40 150 586.60 760 133 218.10 263.90 1,847.10 2,307.70 3.677.30 4,435.00 1,502.80 1.60 -103.8 99.263.20 3,919.00 786.90 680 249.30 2.202.80 Using these statements, calculate the following performance measures: ROE Asset utilization ROA Equity multiplier Net interest margin Tax management efficiency Net noninterest margin Expense control efficiency Net operating margin Asset management efficiency Earnings spread Funds management efficiency Net profit margin Operating efficiency ratio Step by Step Solution
There are 3 Steps involved in it
Step: 1

Get Instant Access to Expert-Tailored Solutions
See step-by-step solutions with expert insights and AI powered tools for academic success
Step: 2

Step: 3

Ace Your Homework with AI
Get the answers you need in no time with our AI-driven, step-by-step assistance
Get Started


