

Question
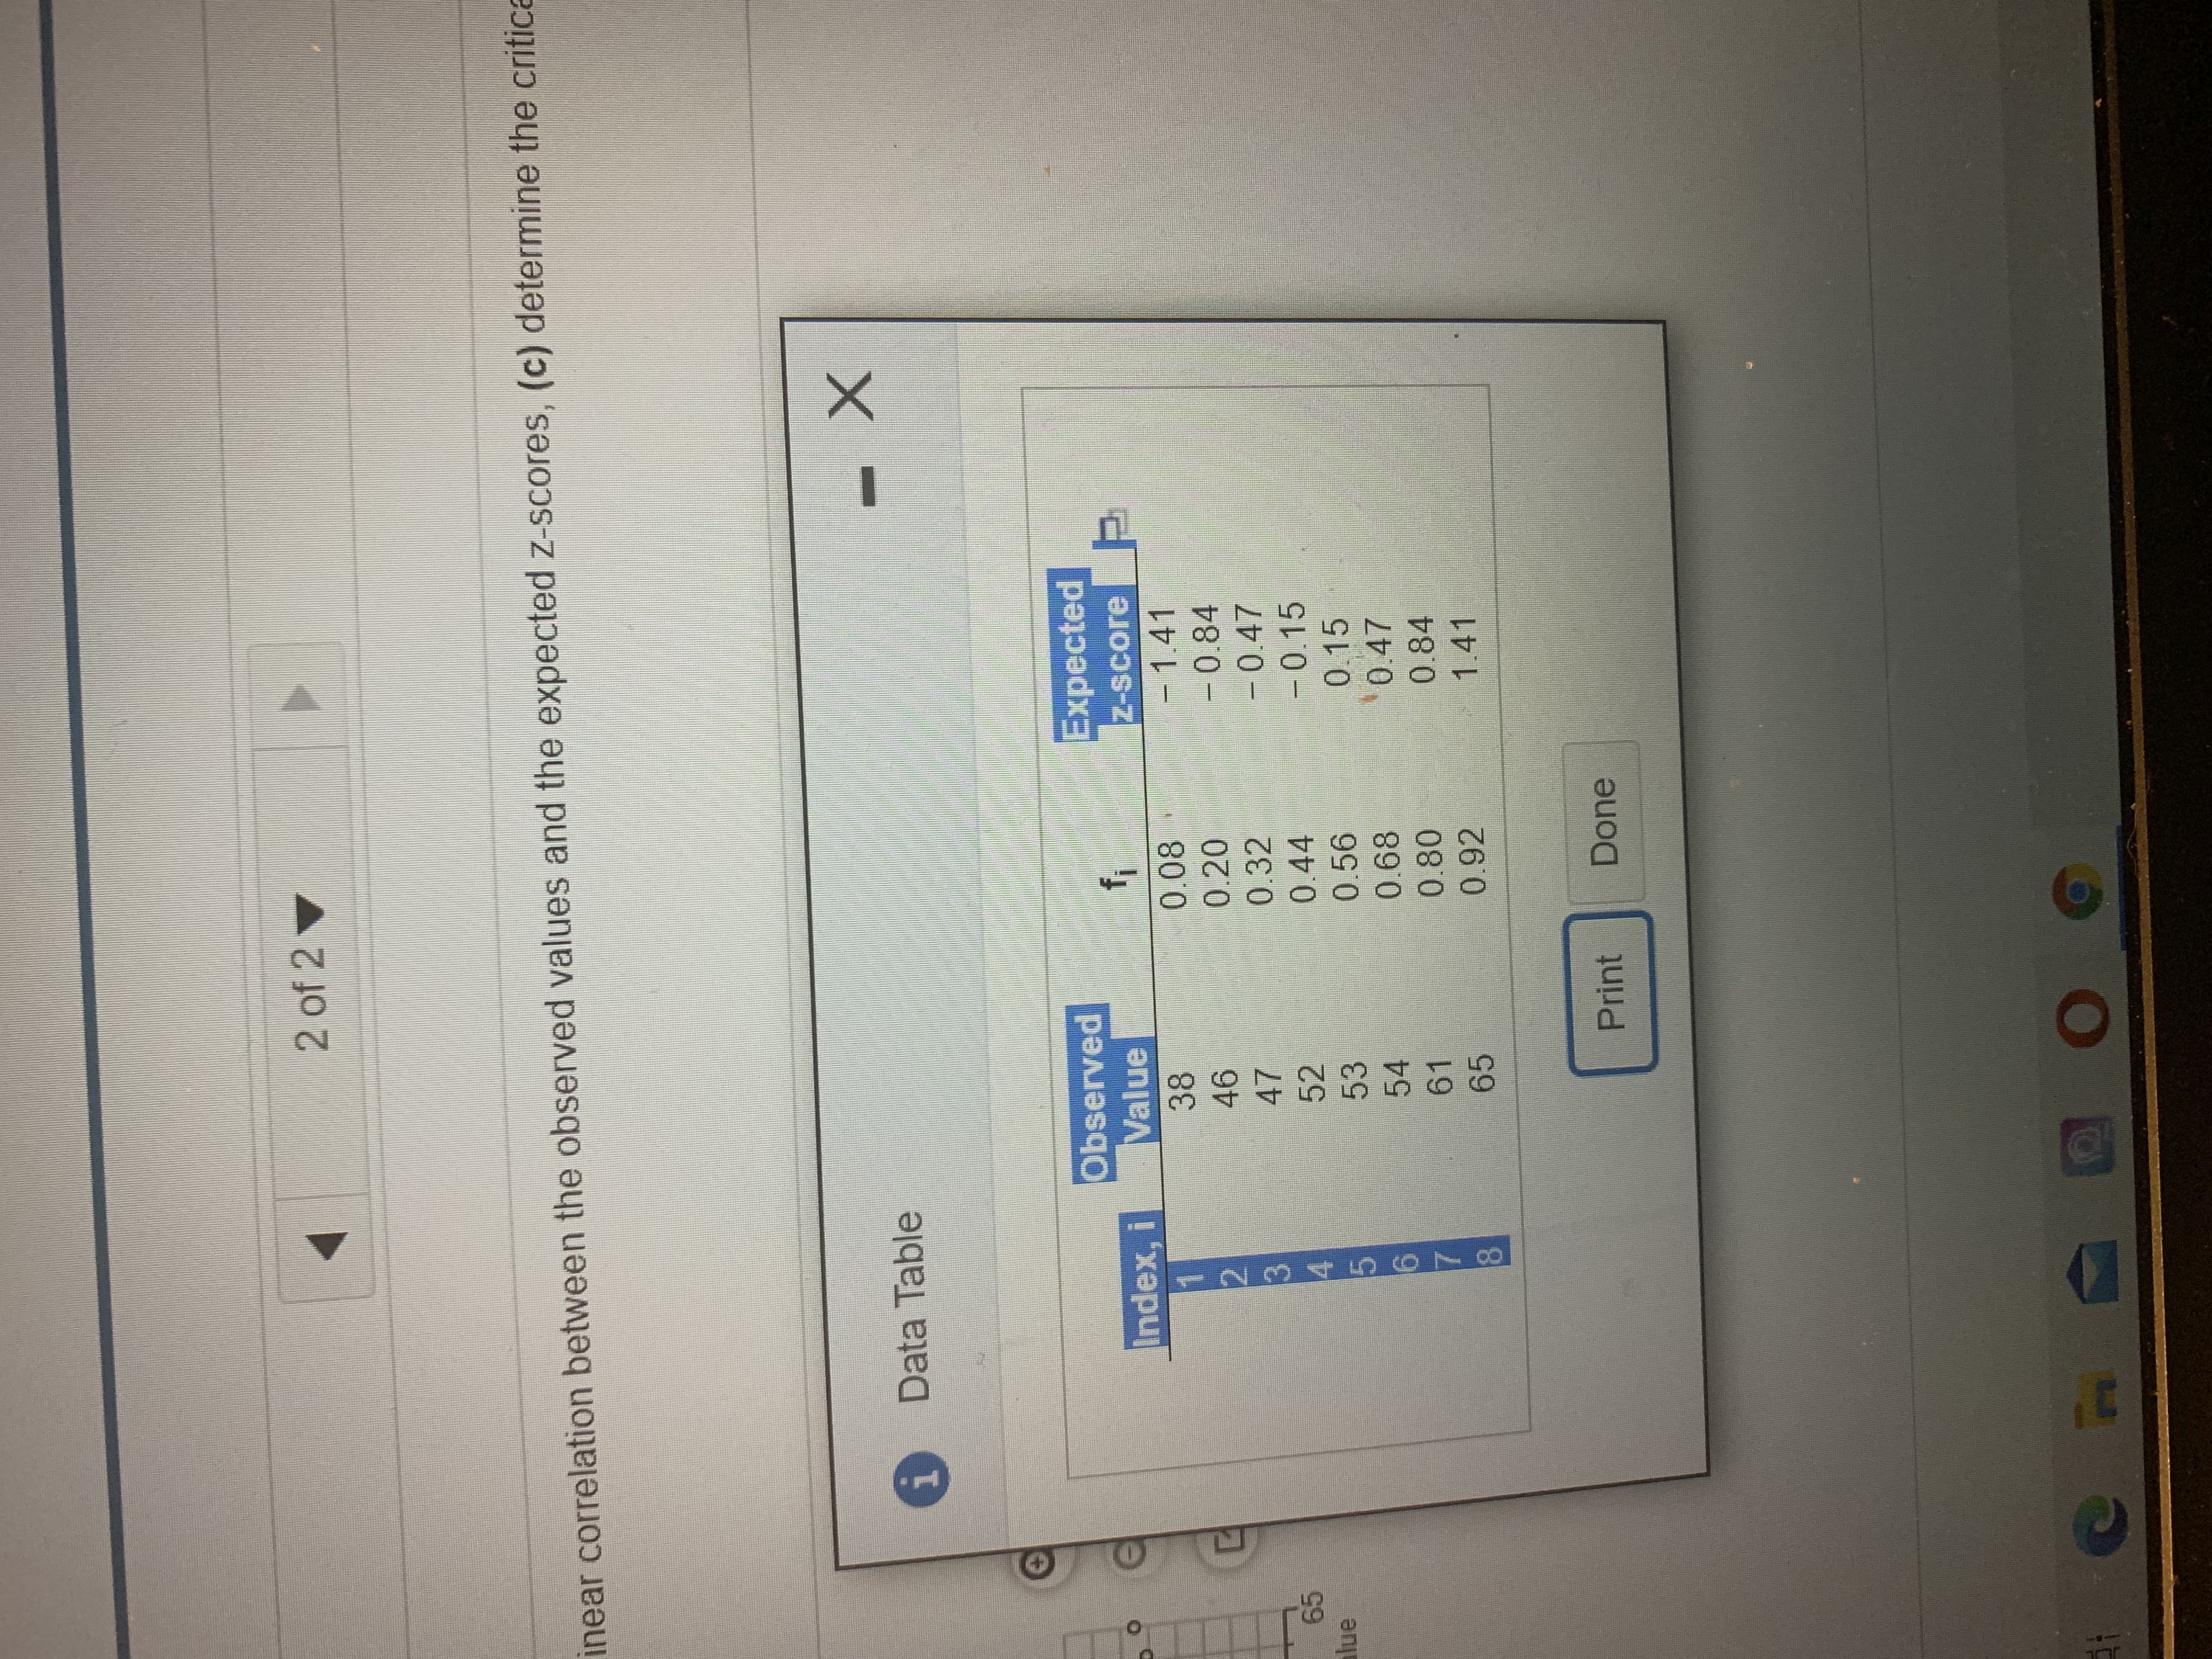
Use the accompanying data table to (a) draw a normal probabilityplot, (b) determine the linear correlation between the observed values and the expectedz-scores, (c) determine
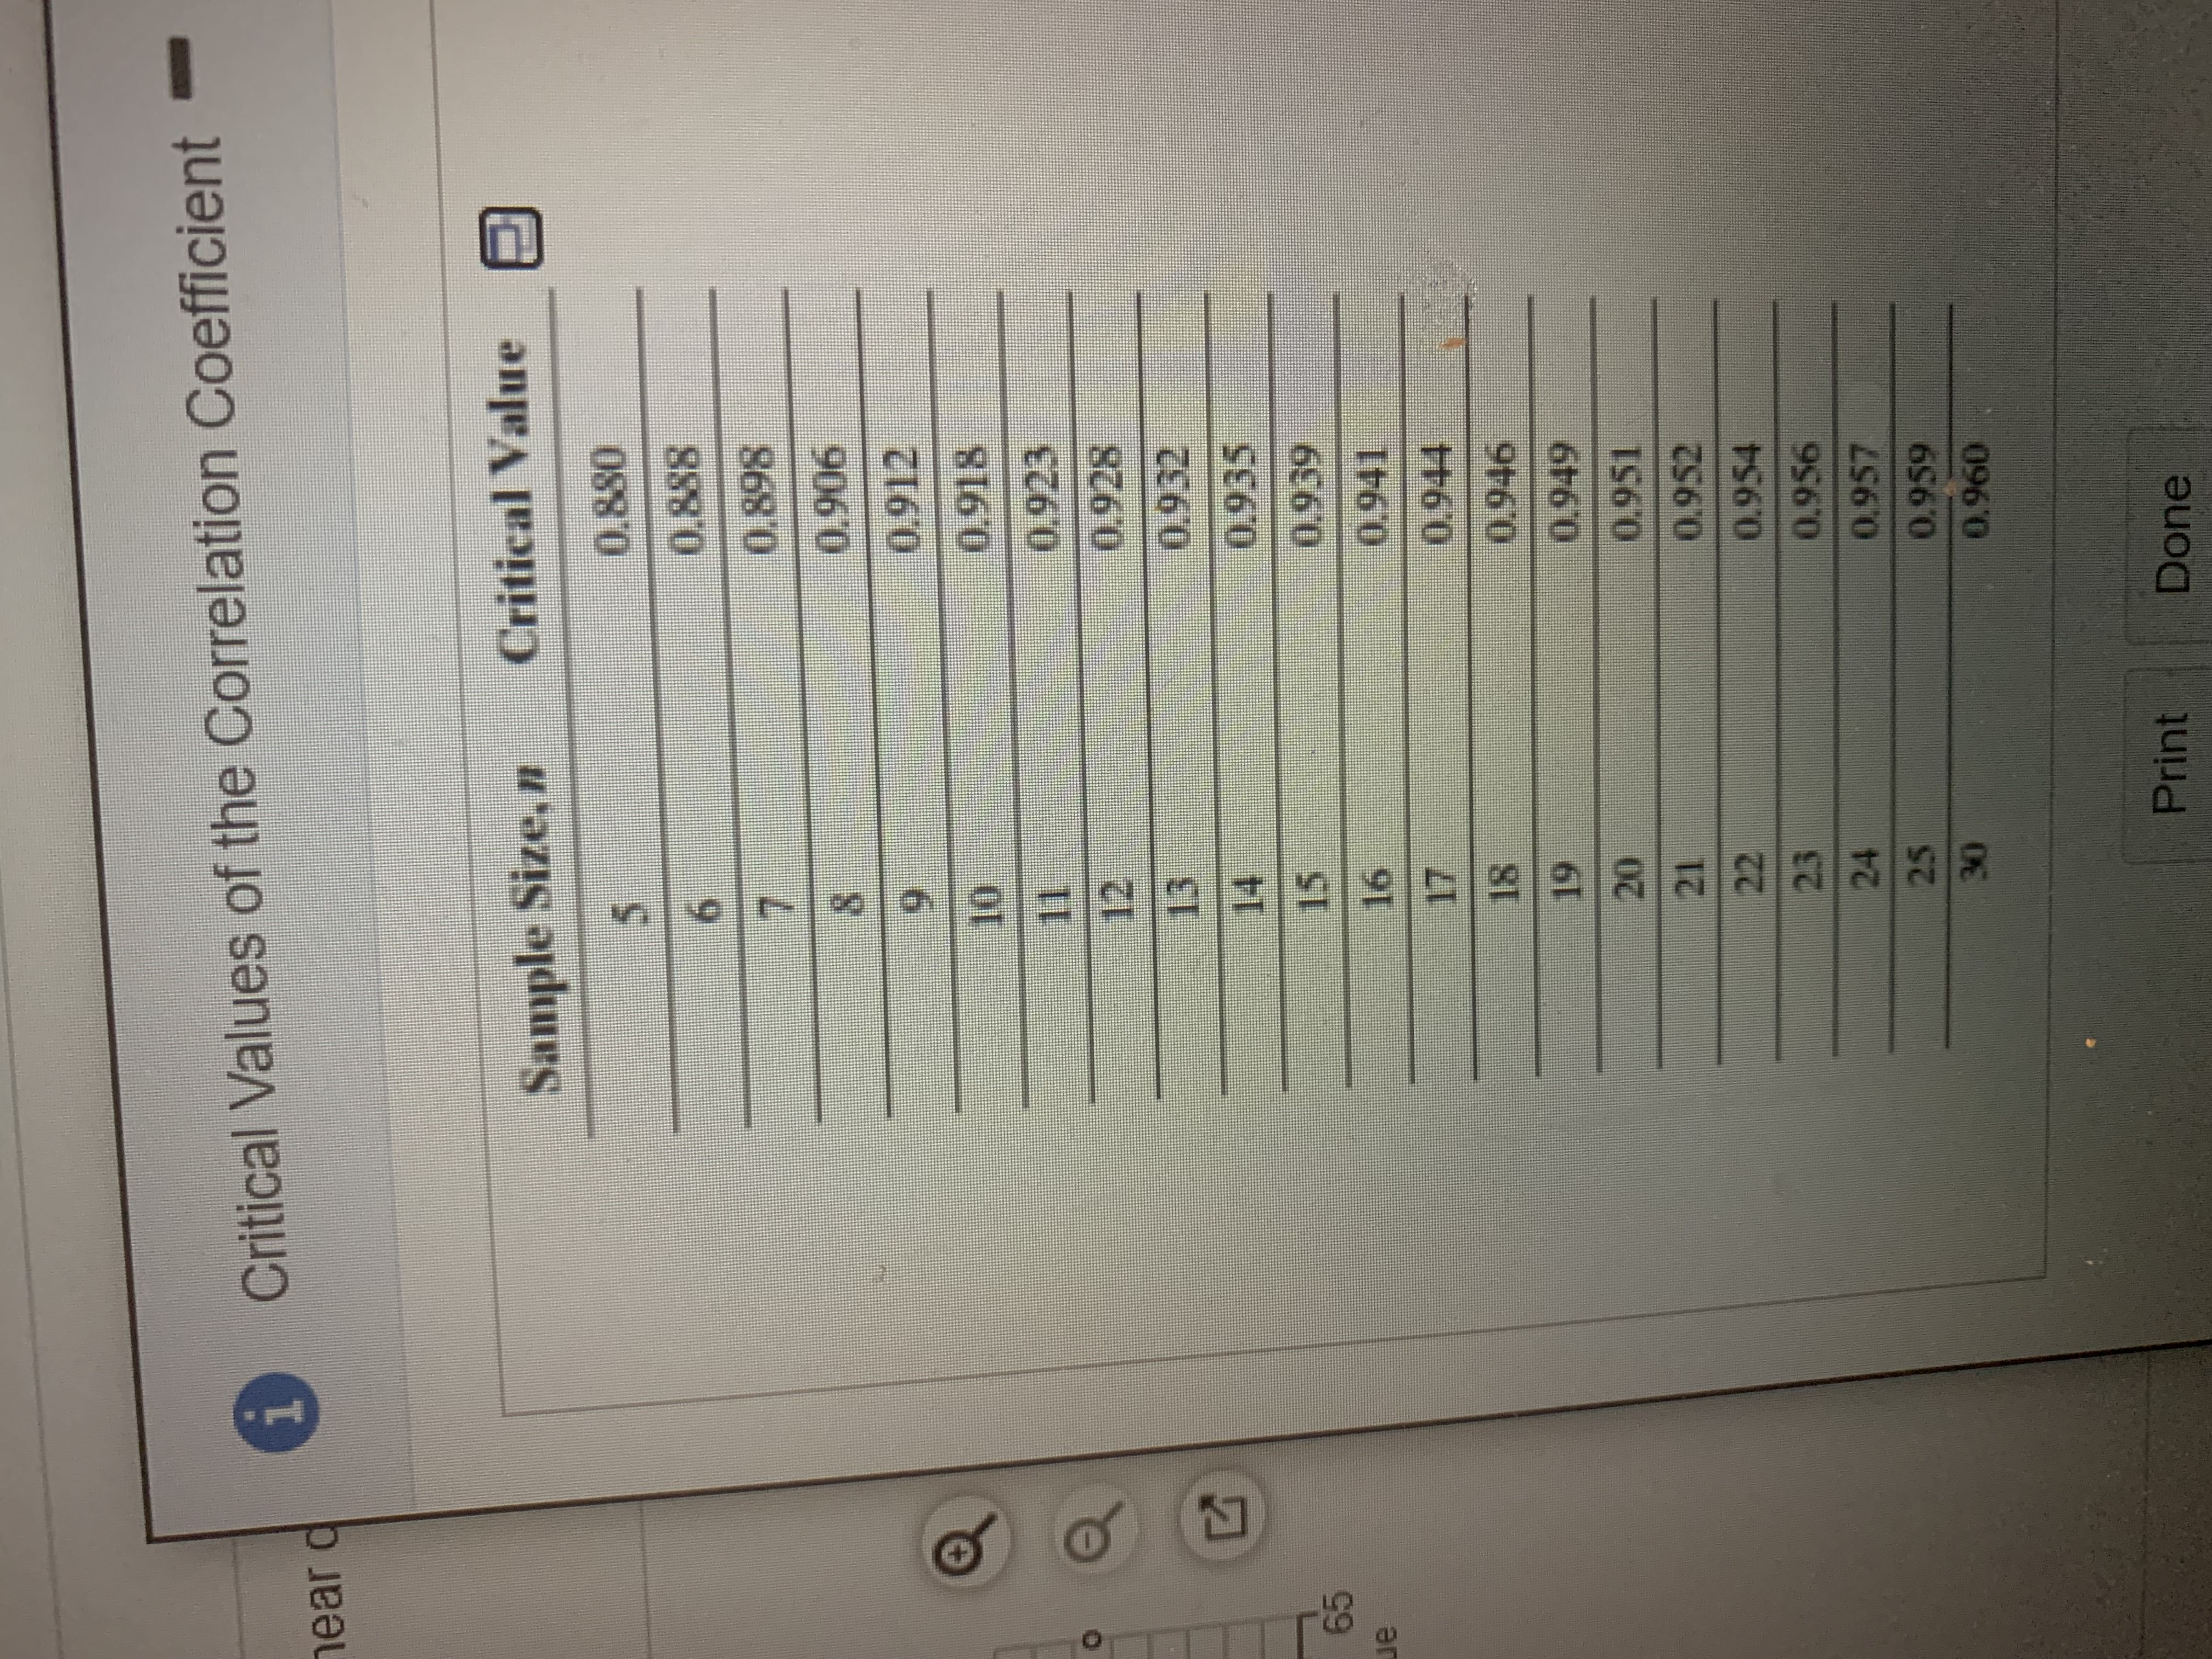
Use the accompanying data table to (a) draw a normal probabilityplot, (b) determine the linear correlation between the observed values and the expectedz-scores, (c) determine the critical value in the table of critical values of the correlation coefficient to assess the normality of the data.
Step by Step Solution
There are 3 Steps involved in it
Step: 1

Get Instant Access to Expert-Tailored Solutions
See step-by-step solutions with expert insights and AI powered tools for academic success
Step: 2

Step: 3
Ace Your Homework with AI
Get the answers you need in no time with our AI-driven, step-by-step assistance
Get Started
Trigonometry A Unit Circle Approach
Authors: Michael Sullivan
10th Edition
0321999347, 9780321999344