Answered step by step
Verified Expert Solution
Question
1 Approved Answer
Use the accompanying manufacturing measurements data to compute sample means, assuming that each row in the data represents a sample from the manufacturing process. Plot
Use the accompanying manufacturing measurements data to compute sample means, assuming that each row in the data represents a sample from the manufacturing process. Plot the sample means on a line chart, compute the standard deviation of the sample means (not the individual observations!), add empirical rule ranges for the sample means, and interpret your results.
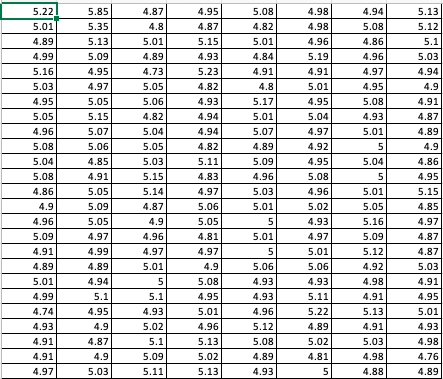
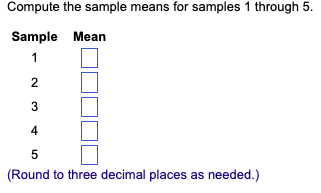
\begin{tabular}{|r|r|r|r|r|r|r|r|} \hline 5.22 & 5.85 & 4.87 & 4.95 & 5.08 & 4.98 & 4.94 & 5.13 \\ \hline 5.01 & 5.35 & 4.8 & 4.87 & 4.82 & 4.98 & 5.08 & 5.12 \\ \hline 4.89 & 5.13 & 5.01 & 5.15 & 5.01 & 4.96 & 4.86 & 5.1 \\ \hline 4.99 & 5.09 & 4.89 & 4.93 & 4.84 & 5.19 & 4.96 & 5.03 \\ \hline 5.16 & 4.95 & 4.73 & 5.23 & 4.91 & 4.91 & 4.97 & 4.94 \\ \hline 5.03 & 4.97 & 5.05 & 4.82 & 4.8 & 5.01 & 4.95 & 4.9 \\ \hline 4.95 & 5.05 & 5.06 & 4.93 & 5.17 & 4.95 & 5.08 & 4.91 \\ \hline 5.05 & 5.15 & 4.82 & 4.94 & 5.01 & 5.04 & 4.93 & 4.87 \\ \hline 4.96 & 5.07 & 5.04 & 4.94 & 5.07 & 4.97 & 5.01 & 4.89 \\ \hline 5.08 & 5.06 & 5.05 & 4.82 & 4.89 & 4.92 & 5 & 4.9 \\ \hline 5.04 & 4.85 & 5.03 & 5.11 & 5.09 & 4.95 & 5.04 & 4.86 \\ \hline 5.08 & 4.91 & 5.15 & 4.83 & 4.96 & 5.08 & 5 & 4.95 \\ \hline 4.86 & 5.05 & 5.14 & 4.97 & 5.03 & 4.96 & 5.01 & 5.15 \\ \hline 4.9 & 5.09 & 4.87 & 5.06 & 5.01 & 5.02 & 5.05 & 4.85 \\ \hline 4.96 & 5.05 & 4.9 & 5.05 & 5 & 4.93 & 5.16 & 4.97 \\ \hline 5.09 & 4.97 & 4.96 & 4.81 & 5.01 & 4.97 & 5.09 & 4.87 \\ \hline 4.91 & 4.99 & 4.97 & 4.97 & 5 & 5.01 & 5.12 & 4.87 \\ \hline 4.89 & 4.89 & 5.01 & 4.9 & 5.06 & 5.06 & 4.92 & 5.03 \\ \hline 5.01 & 4.94 & 5 & 5.08 & 4.93 & 4.93 & 4.98 & 4.91 \\ \hline 4.99 & 5.1 & 5.1 & 4.95 & 4.93 & 5.11 & 4.91 & 4.95 \\ \hline 4.74 & 4.95 & 4.93 & 5.01 & 4.96 & 5.22 & 5.13 & 5.01 \\ \hline 4.93 & 4.9 & 5.02 & 4.96 & 5.12 & 4.89 & 4.91 & 4.93 \\ \hline 4.91 & 4.87 & 5.1 & 5.13 & 5.08 & 5.02 & 5.03 & 4.98 \\ \hline 4.91 & 4.9 & 5.09 & 5.02 & 4.89 & 4.81 & 4.98 & 4.76 \\ \hline 4.97 & 5.03 & 5.11 & 5.13 & 4.93 & 5 & 4.88 & 4.89 \\ \hline \end{tabular} Compute the sample means for samples 1 through 5 . (Round to three decimal places as needed.)Step by Step Solution
There are 3 Steps involved in it
Step: 1
Get Instant Access to Expert-Tailored Solutions
See step-by-step solutions with expert insights and AI powered tools for academic success
Step: 2
Step: 3
Ace Your Homework with AI
Get the answers you need in no time with our AI-driven, step-by-step assistance
Get Started