Answered step by step
Verified Expert Solution
Question
1 Approved Answer
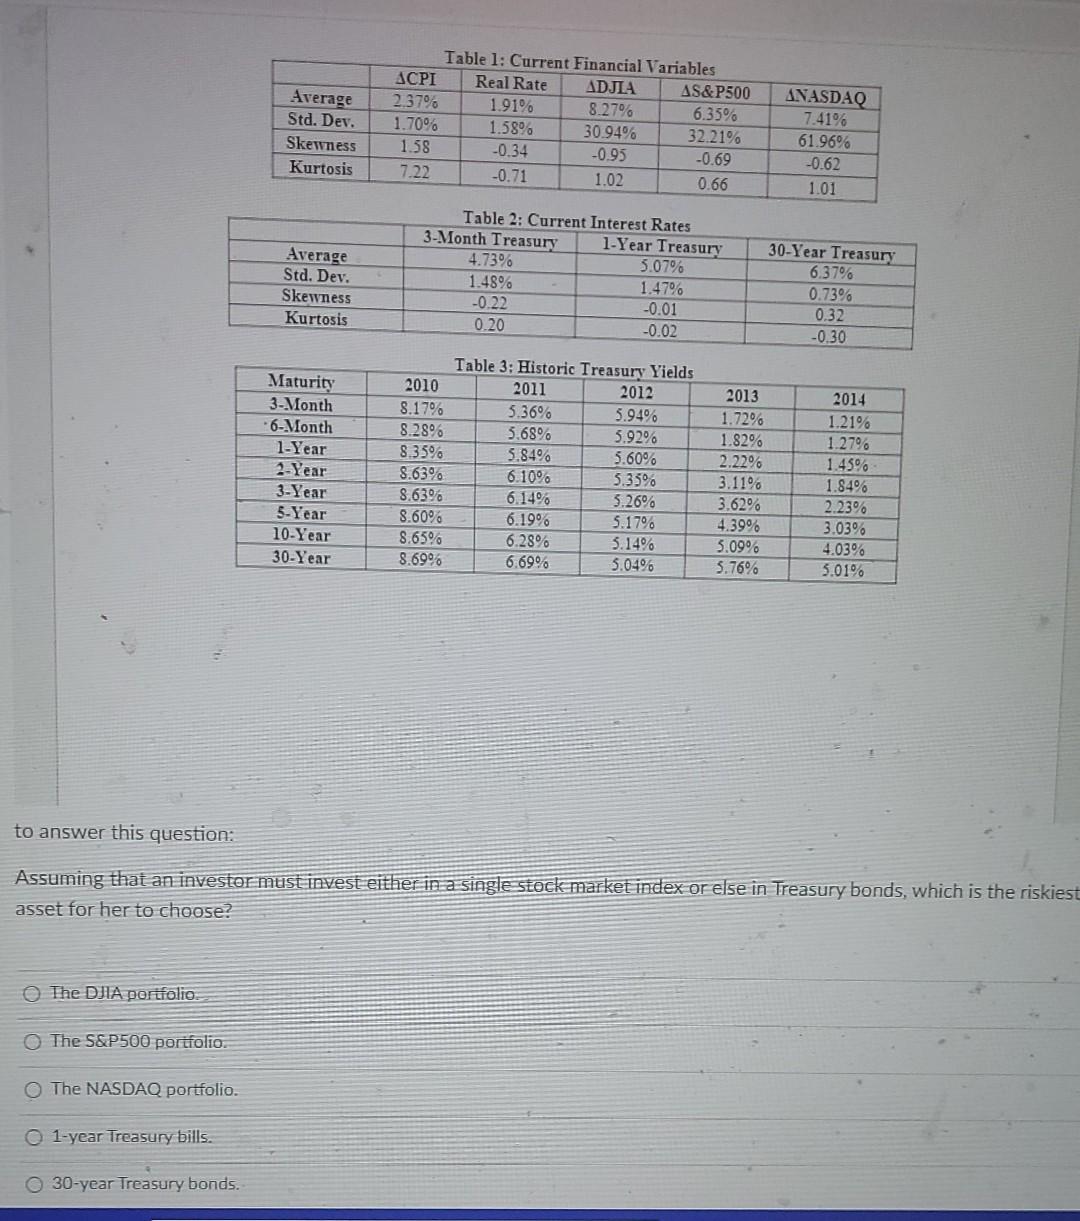
use the any of the graphs to answer question pls quick will upvote Average Std. Dev. Skewness Kurtosis Table 1: Current Financial Variables ACPI Real

use the any of the graphs to answer question pls quick will upvote
Average Std. Dev. Skewness Kurtosis Table 1: Current Financial Variables ACPI Real Rate ADJIA AS&P500 2.37% 1.91% 8.27% 6.35% 1.70% 1.58% 30.94% 32.21% 1.58 -0.34 -0.93 -0.69 7.22 -0.71 1.02 0.66 ANASDAQ 7.41% 61.96% -0.62 1.01 Average Std. Dev. Skewness Kurtosis Table 2: Current Interest Rates 3-Month Treasury 1-Year Treasury 4.73% 5.07% 1.48% 1.47% -0.22 -0.01 0.20 -0.02 30-Year Treasury 6.37% 0.73% 0.32 -0.30 Maturity 3-Month 6-Month 1-Year 2-Year 3-Year 5-Year 10-Year 30-Year 2010 8.17% 8.28% 8.35% 8.63% 8.63% 8.60% 8.65% 8.69% Table 3: Historic Treasury Yields 2011 2012 5.36% 5.94% 5.68% 5.92% 5.84% 5.60% 6.10% 5.35 6.14% 5.26% 6.19% 5.17% 6.28% 3.14% 6.69% 5.04% 2013 1.72% 1.82% 2.22% 3.11% 3.62% 4.39% 5.09% 5.76% 2014 1.21% 1.27% 1.45% 1.84% 2.23% 3.03% 4.03% 3.01% to answer this question: Assuming that an investor must invest either in a single stock market index or else in Treasury bonds, which is the riskiest asset for her to choose? The DJIA portfolio The S&P500 portfolio The NASDAQ portfolio. O 1-year Treasury bills. 30-year Treasury bondsStep by Step Solution
There are 3 Steps involved in it
Step: 1

Get Instant Access to Expert-Tailored Solutions
See step-by-step solutions with expert insights and AI powered tools for academic success
Step: 2

Step: 3

Ace Your Homework with AI
Get the answers you need in no time with our AI-driven, step-by-step assistance
Get Started


