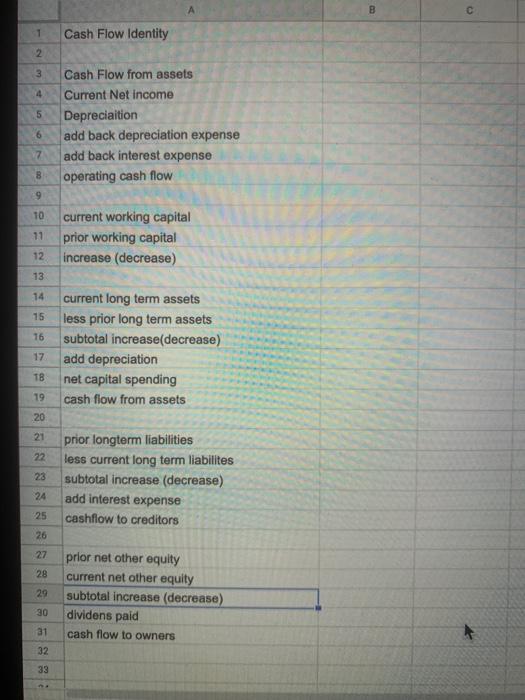
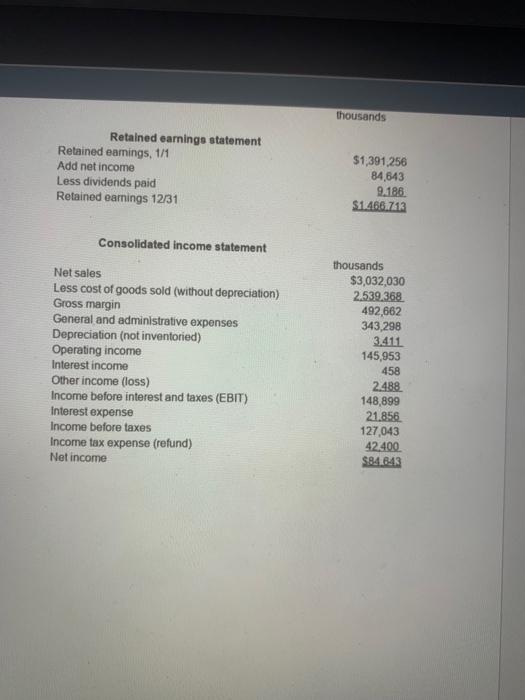
use the balance sheet to fill out the cash flpw identity excel
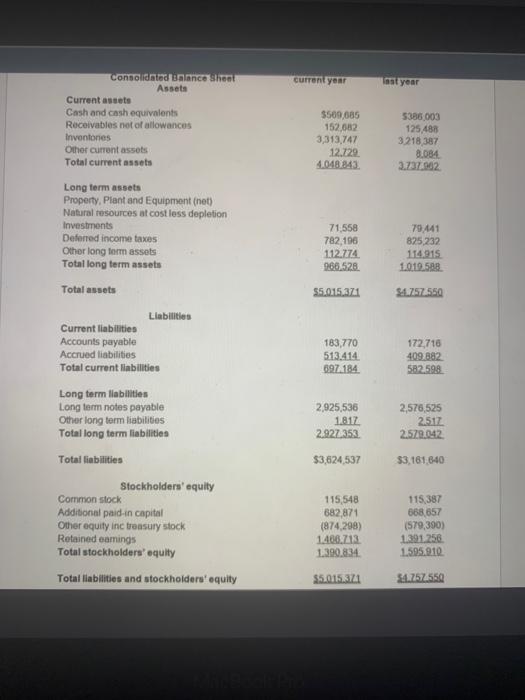
current year Last year consolidated Banco Shoot Assets Current assets Cash and cash equivalents Receivables not of allowances Inventones Other current assets Total current assets $500 685 152.682 3,313,747 12.729 4.048 843 5386003 125488 3218 387 8.084 3.737902 71.558 782,196 112.774 966,528 79.441 825232 114.915 1010.588 55015371 $4.757.550 183,770 513.414 697.184 172,710 409.882 582.598 Long term assets Property, Piant and Equipment (net) Natural resources at cost less depletion Investments Deferred income taxes Other long for assets Total long term assets Total assets Liabilities Current liabilities Accounts payable Accrued liabilities Total current liabilities Long term liabilities Long term notes payable Other long term liabilities Total long term liabilities Total liabilities Stockholders' equity Common stock Additional paid in capital Other equity inc treasury stock Retained earings Total stockholders' equity Total liabilities and stockholders' equity 2,925,536 1.812 2.927 353 2,576,525 2.517 2.57.042 $3,624,537 $3,161,640 115,548 682,871 (874.298) 1.406,713 1.390.834 115,387 868,657 (579,390) 1391.256 1.595.910 $5.015371 $4.7574550 B 1 Cash Flow Identity 2 3 4 5 Cash Flow from assets Current Net Income Depreciation add back depreciation expense add back interest expense operating cash flow 6 7 8 9 10 11 current working capital prior working capital increase (decrease) 12 13 14 15 16 current long term assets less prior long term assets subtotal increase(decrease) add depreciation net capital spending cash flow from assets 17 TB 19 20 21 22 23 prior longterm liabilities less current long term liabilites subtotal increase (decrease) add interest expense cashflow to creditors 24 25 26 27 28 29 prior niet other equity current net other equity subtotal increase (decrease) dividens paid cash flow to owners 30 31 32 33 thousands Retained earnings statement Retained earings, 1/1 Add net income Less dividends paid Retained earnings 12/31 $1,391,256 84.643 9.186 $1.466.71 Consolidated income statement Net sales Less cost of goods sold (without depreciation) Gross margin General and administrative expenses Depreciation (not inventoried) Operating income Interest income Other income (loss) Income before interest and taxes (EBIT) Interest expense Income before taxes Income tax expense (refund) Net income thousands $3,032,030 2.539.368 492,662 343,298 3.411 145,953 458 2.488 148,899 21.858. 127,043 42.400 $84.643 current year Last year consolidated Banco Shoot Assets Current assets Cash and cash equivalents Receivables not of allowances Inventones Other current assets Total current assets $500 685 152.682 3,313,747 12.729 4.048 843 5386003 125488 3218 387 8.084 3.737902 71.558 782,196 112.774 966,528 79.441 825232 114.915 1010.588 55015371 $4.757.550 183,770 513.414 697.184 172,710 409.882 582.598 Long term assets Property, Piant and Equipment (net) Natural resources at cost less depletion Investments Deferred income taxes Other long for assets Total long term assets Total assets Liabilities Current liabilities Accounts payable Accrued liabilities Total current liabilities Long term liabilities Long term notes payable Other long term liabilities Total long term liabilities Total liabilities Stockholders' equity Common stock Additional paid in capital Other equity inc treasury stock Retained earings Total stockholders' equity Total liabilities and stockholders' equity 2,925,536 1.812 2.927 353 2,576,525 2.517 2.57.042 $3,624,537 $3,161,640 115,548 682,871 (874.298) 1.406,713 1.390.834 115,387 868,657 (579,390) 1391.256 1.595.910 $5.015371 $4.7574550 B 1 Cash Flow Identity 2 3 4 5 Cash Flow from assets Current Net Income Depreciation add back depreciation expense add back interest expense operating cash flow 6 7 8 9 10 11 current working capital prior working capital increase (decrease) 12 13 14 15 16 current long term assets less prior long term assets subtotal increase(decrease) add depreciation net capital spending cash flow from assets 17 TB 19 20 21 22 23 prior longterm liabilities less current long term liabilites subtotal increase (decrease) add interest expense cashflow to creditors 24 25 26 27 28 29 prior niet other equity current net other equity subtotal increase (decrease) dividens paid cash flow to owners 30 31 32 33 thousands Retained earnings statement Retained earings, 1/1 Add net income Less dividends paid Retained earnings 12/31 $1,391,256 84.643 9.186 $1.466.71 Consolidated income statement Net sales Less cost of goods sold (without depreciation) Gross margin General and administrative expenses Depreciation (not inventoried) Operating income Interest income Other income (loss) Income before interest and taxes (EBIT) Interest expense Income before taxes Income tax expense (refund) Net income thousands $3,032,030 2.539.368 492,662 343,298 3.411 145,953 458 2.488 148,899 21.858. 127,043 42.400 $84.643