

Answered step by step
Verified Expert Solution
Question
1 Approved Answer
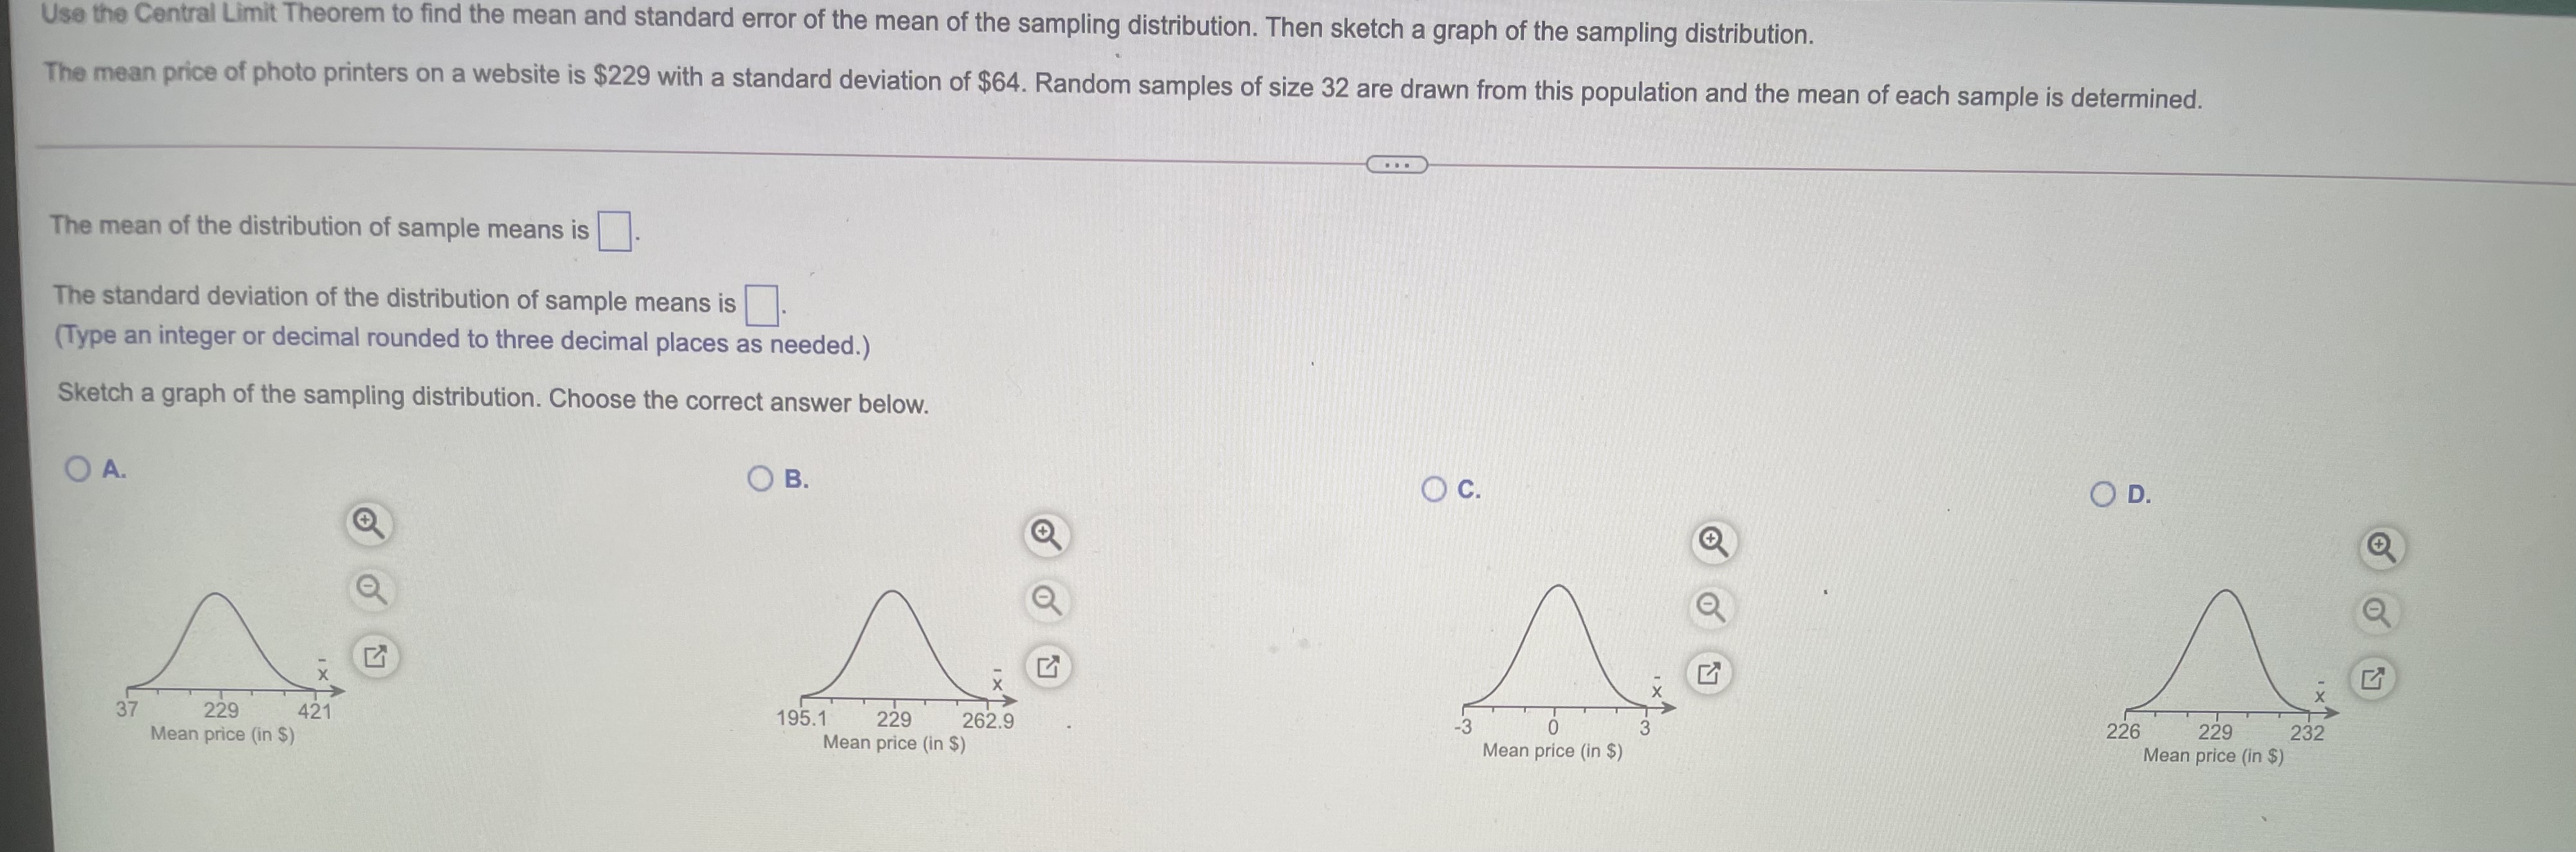
Use the Central Limit Theorem to find the mean and standard error of the mean of the sampling distribution. Then sketch a graph of the
Step by Step Solution
There are 3 Steps involved in it
Step: 1

Get Instant Access to Expert-Tailored Solutions
See step-by-step solutions with expert insights and AI powered tools for academic success
Step: 2

Step: 3
Ace Your Homework with AI
Get the answers you need in no time with our AI-driven, step-by-step assistance
Get Started
Finite Mathematics
Authors: Stefan Waner, Steven Costenoble
7th Edition
133751554X, 9781337515542