

Answered step by step
Verified Expert Solution
Question
1 Approved Answer
use the college data set in ISLR install it from R the code for it is library(ISLR) attach(College) please show work in R code 3.
use the college data set in ISLR install it from R the code for it is library(ISLR) attach(College) please show work in R code
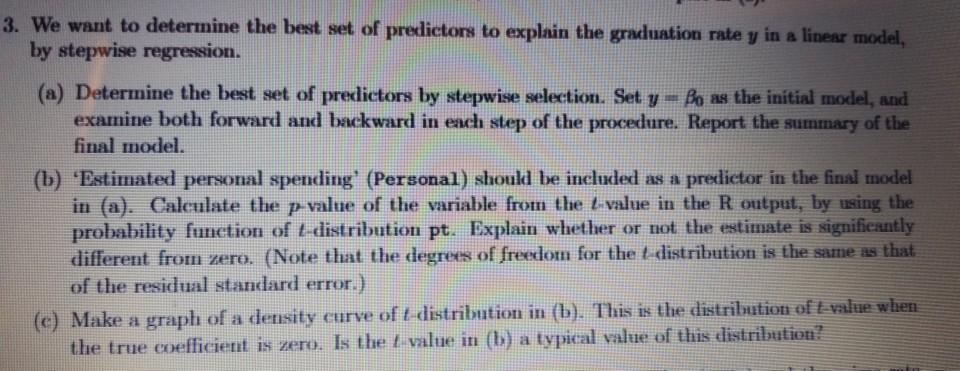
3. We want to determine the best set of predictors to explain the graduation rate in a linear model by stepwise regression. (a) Determine the best set of predictors by stepwise selection. Set y- o ag the initial model and examine both forward and backward in each step of the procedure. Report the summary of the final model. (b) 'Estimated personal spending (Personal) should be included as a predictor in the final model in (a). Calculate the p value of the variable from the t value in the R output, by using the probability function of t-distribution pt. Explain whether or not the estimate is signifieantly different from zero. (Note that the degrees of freedom for the t distribution is the same as that of the residual standard error) ion of t-vale ue when (c) Make a graph of a density curve of t distribution in (b). This is the distribut the true coefficient is zero. Is the t-value in (b) a typical value of this distribution? 3. We want to determine the best set of predictors to explain the graduation rate in a linear model by stepwise regression. (a) Determine the best set of predictors by stepwise selection. Set y- o ag the initial model and examine both forward and backward in each step of the procedure. Report the summary of the final model. (b) 'Estimated personal spending (Personal) should be included as a predictor in the final model in (a). Calculate the p value of the variable from the t value in the R output, by using the probability function of t-distribution pt. Explain whether or not the estimate is signifieantly different from zero. (Note that the degrees of freedom for the t distribution is the same as that of the residual standard error) ion of t-vale ue when (c) Make a graph of a density curve of t distribution in (b). This is the distribut the true coefficient is zero. Is the t-value in (b) a typical value of this distributionStep by Step Solution
There are 3 Steps involved in it
Step: 1

Get Instant Access to Expert-Tailored Solutions
See step-by-step solutions with expert insights and AI powered tools for academic success
Step: 2

Step: 3
Ace Your Homework with AI
Get the answers you need in no time with our AI-driven, step-by-step assistance
Get Started
Database Systems Design Implementation And Management
Authors: Carlos Coronel, Steven Morris
14th Edition
978-0357673034