

Answered step by step
Verified Expert Solution
Question
1 Approved Answer
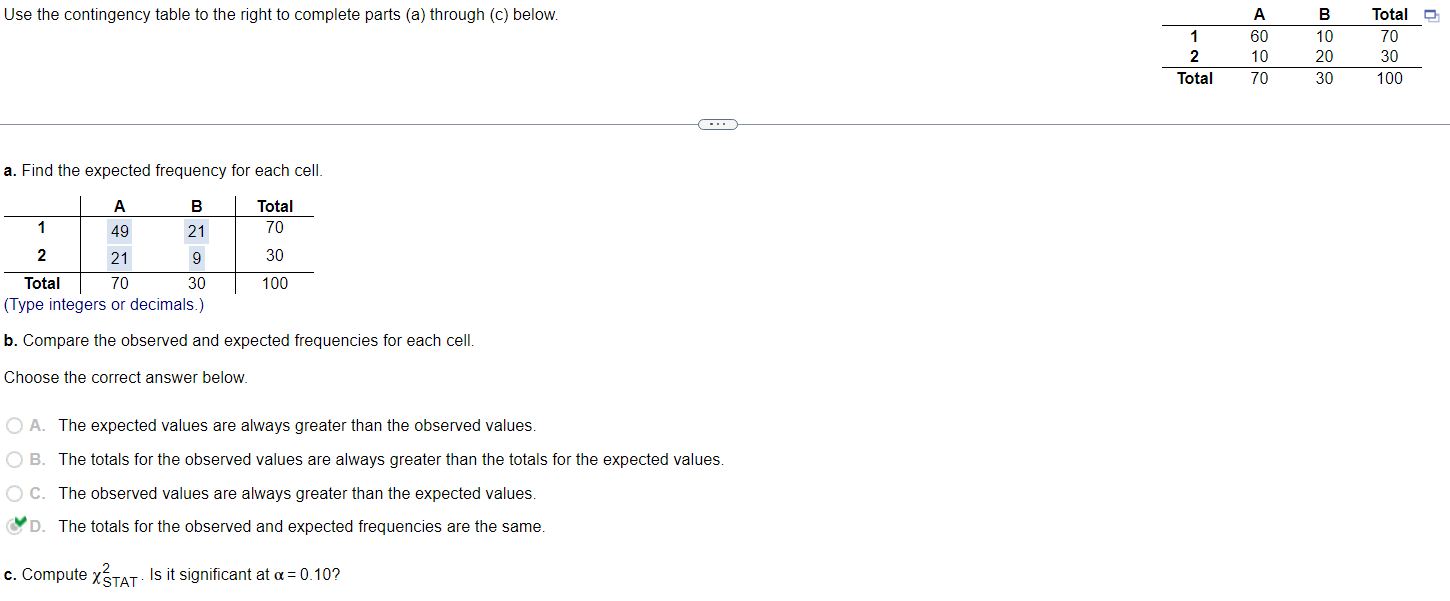
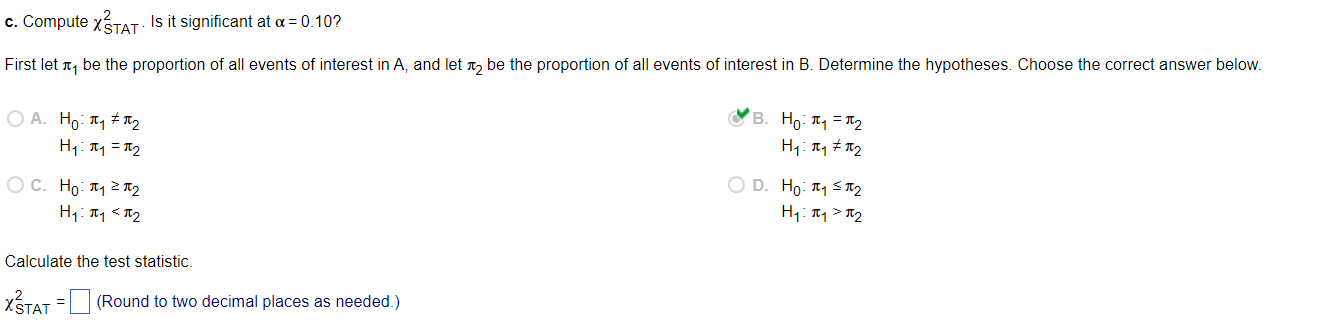
Use the contingency table to the right to complete parts (a) through (c) below Total 60 10 70 B 10 20 30 Total 70 30
Step by Step Solution
There are 3 Steps involved in it
Step: 1

Get Instant Access to Expert-Tailored Solutions
See step-by-step solutions with expert insights and AI powered tools for academic success
Step: 2

Step: 3
Ace Your Homework with AI
Get the answers you need in no time with our AI-driven, step-by-step assistance
Get Started