

Answered step by step
Verified Expert Solution
Question
1 Approved Answer
Use the COUNTIF function to construct frequency distributions for gender, preferred style, and purchase influence for the data provided, develop column charts to express the
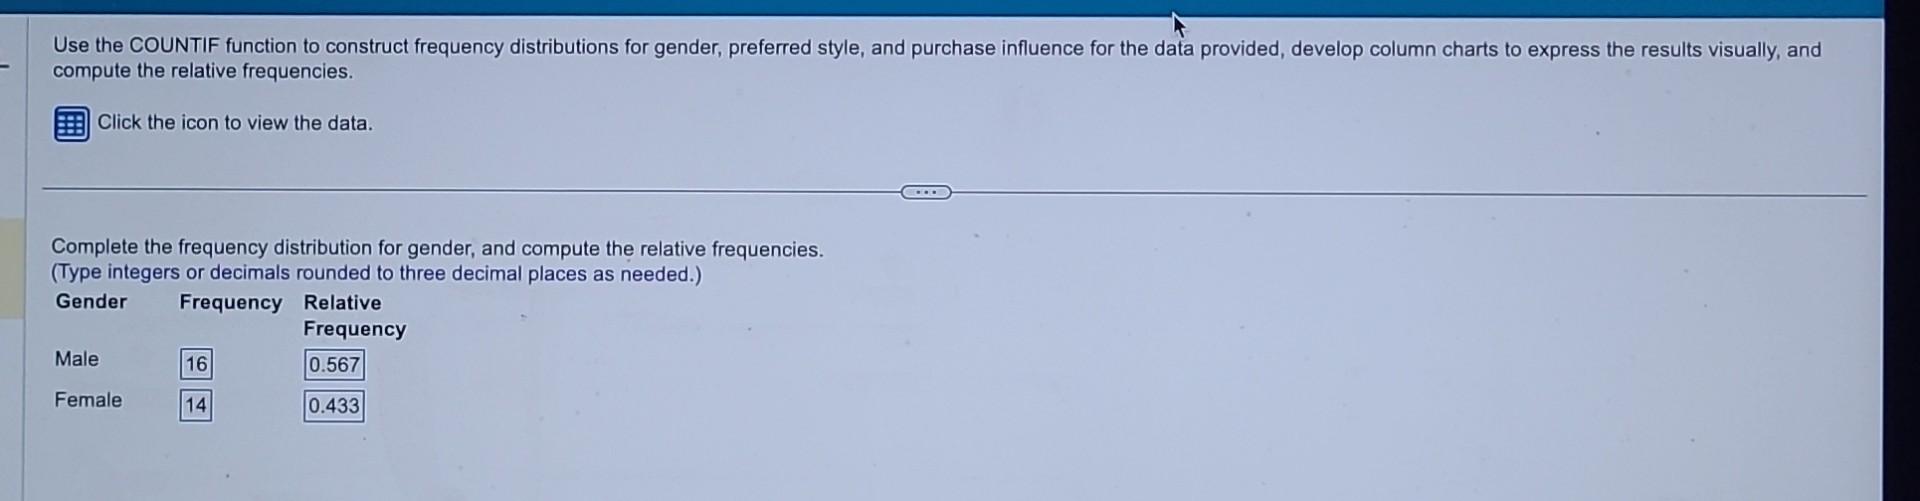
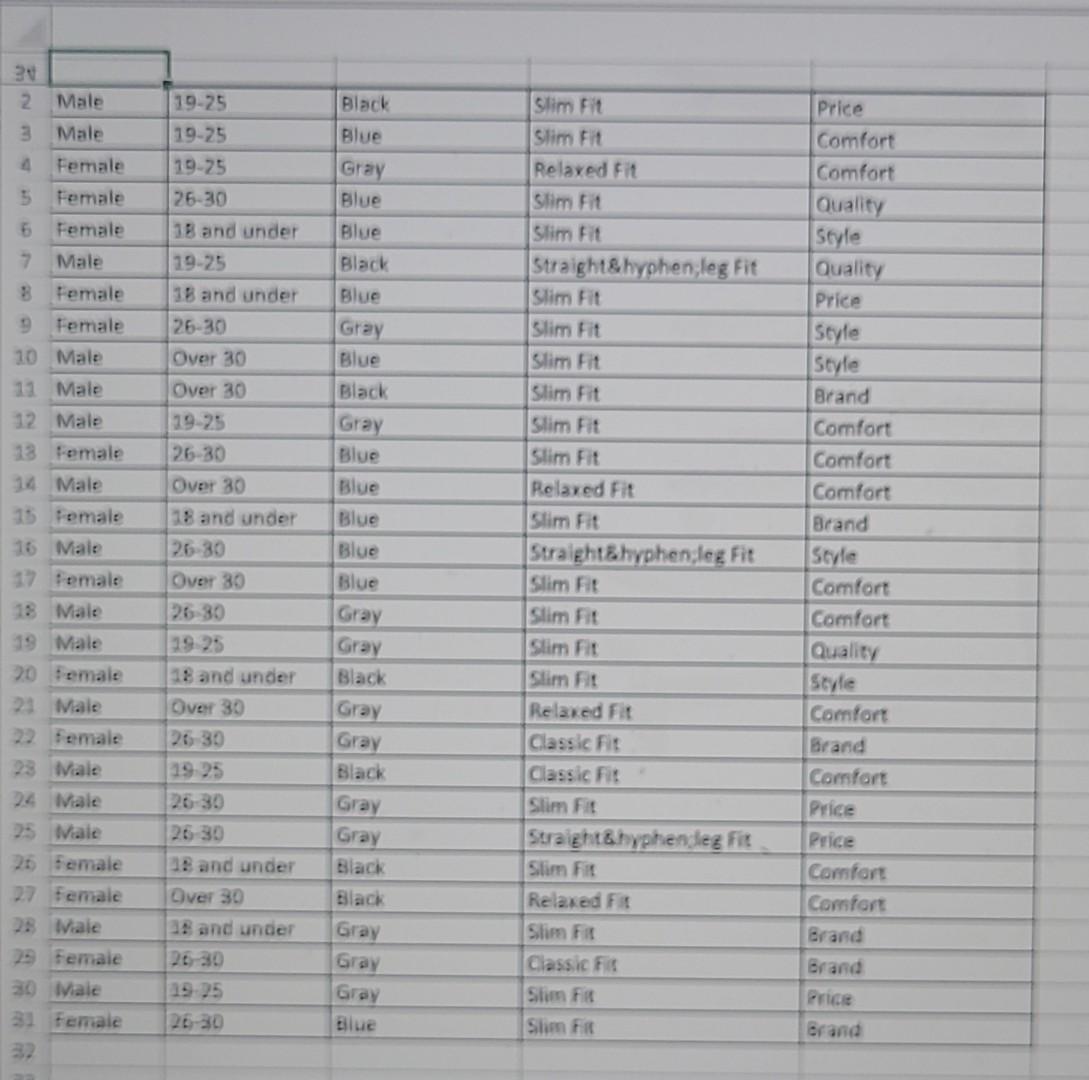
Use the COUNTIF function to construct frequency distributions for gender, preferred style, and purchase influence for the data provided, develop column charts to express the results visually, and compute the relative frequencies. Click the icon to view the data. Complete the frequency distribution for gender, and compute the relative frequencies. (Type integers or decimals rounded to three decimal places as needed.)
Step by Step Solution
There are 3 Steps involved in it
Step: 1

Get Instant Access to Expert-Tailored Solutions
See step-by-step solutions with expert insights and AI powered tools for academic success
Step: 2

Step: 3
Ace Your Homework with AI
Get the answers you need in no time with our AI-driven, step-by-step assistance
Get Started
MRA/HCC Chart Review And Documentation Guide A Brief Step By Step Guide On Chart Audits For Optimal Risk Adjustment Captures
Authors: The Coders Choice LLC
1st Edition
1698476965, 978-1698476964