Use the data in the following table. which lists survey results from high school drivers at least 16 years of age. Assume that subjects are
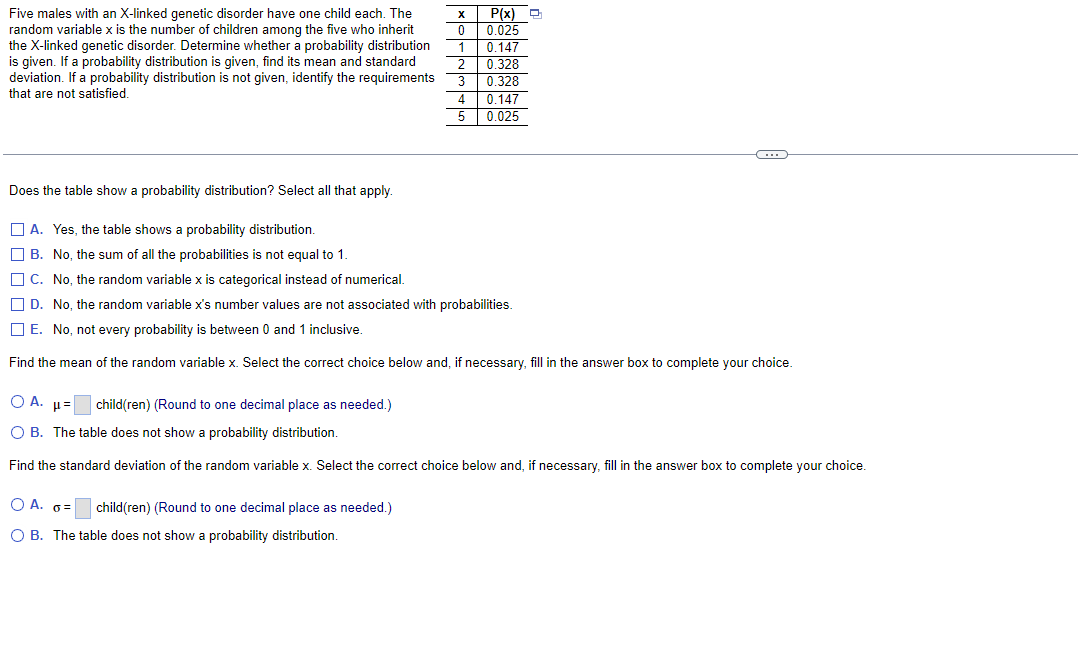
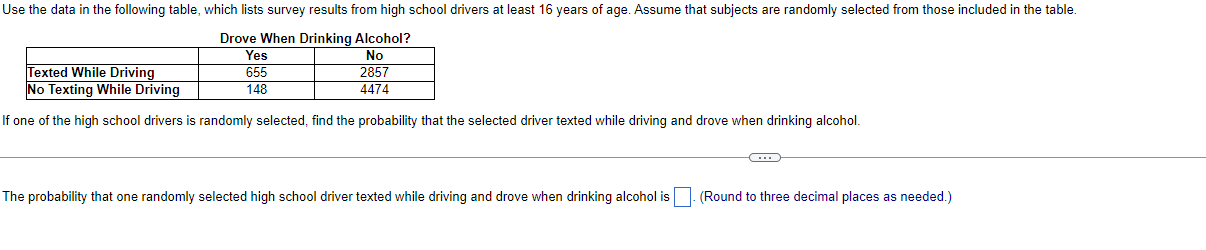
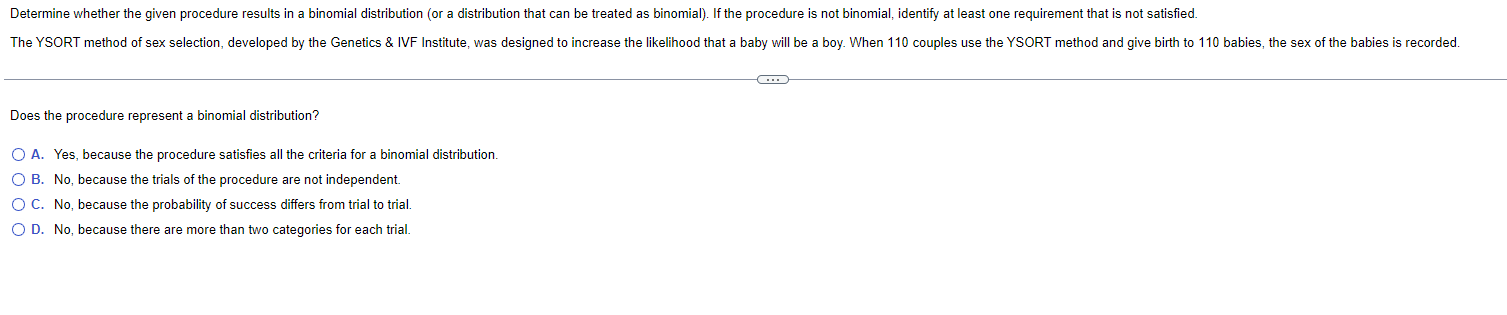
Use the data in the following table. which lists survey results from high school drivers at least 16 years of age. Assume that subjects are randomlyr selected from those included in the table. Drove When Drinking Alcohol? Yes No Texted While Driving 555 2857 No Texting While Driving 148 rialM If one of the high school drivers is randomly selected: find the probability that the selected driver texted while driving and drove when drinking alcohol. The probability that one randomly selected high school dn'ver texted while driving and drove when drinking alcohol is . (Round to three decimal places as needed.) Five males with an X-linked genetic disorder have one child each. The random variable x is the number of children among the ve who inherit the X-Iinked genetic disorder. Determine whether a probability distribution is given. If a probability distribution is given. nd its mean and standard deviation. If a probability distribution is not given. identify the requirements that are not satisfied. 3-: .0 ,_, 35. El 33 o: M CD Does the table show a probability distribution? Select all that apply. Yes. the table shows a probability distribution. No. the sum of all the probabilities is not equal to 1. No, the random variable x is categorical instead of numerical. No. the random variable x's number values are not associated with probabilities. [15:09\"? No. not every probability is between {i and 'l inclusive. Find the mean of the random variable x. Select the correct choice below and. if necessary, ll in the answer box to complete your choice. [:1 A- p = child{ren) (Round to one decimal place as needed.) [:1 B. The table does not show a probability distribution. Find the standard deviation ofthe random variable x. Select the conect choice below and. if necessary= ll in the answer box to complete your choice. [:1 A- 6: child(ren} (Round to one decimal place as needed.) [:1 B. The table does not show a probability distribution. Determine whether the given procedure results in a binomial distribution (or a distribution that can be treated as binomial). If the procedure is not binomial, identify at least one requirement that is not satisfied. The YSORT method of sex selection, developed by the Genetics & IVF Institute, was designed to increase the likelihood that a baby will be a boy. When 110 couples use the YSORT method and give birth to 110 babies, the sex of the babies is recorded. Does the procedure represent a binomial distribution? O A. Yes, because the procedure satisfies all the criteria for a binomial distribution. O B. No, because the trials of the procedure are not independent. O C. No, because the probability of success differs from trial to trial. O D. No, because there are more than two categories for each trial
Step by Step Solution
There are 3 Steps involved in it
Step: 1
Get Instant Access to Expert-Tailored Solutions
See step-by-step solutions with expert insights and AI powered tools for academic success
Step: 2
Step: 3
Ace Your Homework with AI
Get the answers you need in no time with our AI-driven, step-by-step assistance