Question
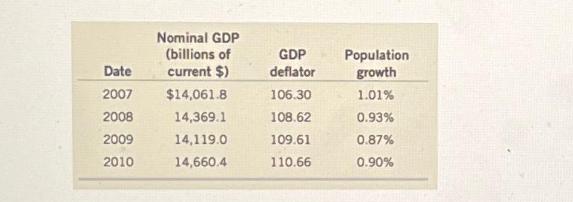
Use the data in the table above to calculate the economic growth rate for the United States from 2008 to 2009. Give your answer


Use the data in the table above to calculate the economic growth rate for the United States from 2008 to 2009. Give your answer to two decimals. Note that all data is from the end of the year specified. % Nominal GDP (billions of GDP Population Date current $) deflator growth 2007 $14,061.8 106.30 1.01% 2008 14,369.1 108.62 0.93% 2009 14,119.0 109.61 0.87% 2010 14,660.4 110.66 0.90%
Step by Step Solution
There are 3 Steps involved in it
Step: 1

Get Instant Access to Expert-Tailored Solutions
See step-by-step solutions with expert insights and AI powered tools for academic success
Step: 2

Step: 3

Ace Your Homework with AI
Get the answers you need in no time with our AI-driven, step-by-step assistance
Get StartedRecommended Textbook for
Basic Business Statistics Concepts And Applications
Authors: Mark L. Berenson, David M. Levine, Timothy C. Krehbiel
12th Edition
132168383, 978-0132168380
Students also viewed these Economics questions
Question
Answered: 1 week ago
Question
Answered: 1 week ago
Question
Answered: 1 week ago
Question
Answered: 1 week ago
Question
Answered: 1 week ago
Question
Answered: 1 week ago
Question
Answered: 1 week ago
Question
Answered: 1 week ago
Question
Answered: 1 week ago
Question
Answered: 1 week ago
Question
Answered: 1 week ago
Question
Answered: 1 week ago
Question
Answered: 1 week ago
Question
Answered: 1 week ago
Question
Answered: 1 week ago
Question
Answered: 1 week ago
Question
Answered: 1 week ago
Question
Answered: 1 week ago
Question
Answered: 1 week ago
Question
Answered: 1 week ago
View Answer in SolutionInn App


