

Answered step by step
Verified Expert Solution
Question
1 Approved Answer
Use the data set below to answer the following questions ID 1.00 2.00 3.00 4.00 5.00 6.00 7.00 8.00 9.00 10.00 11.00 12.00 13.00 14.00
Use the data set below to answer the following questions 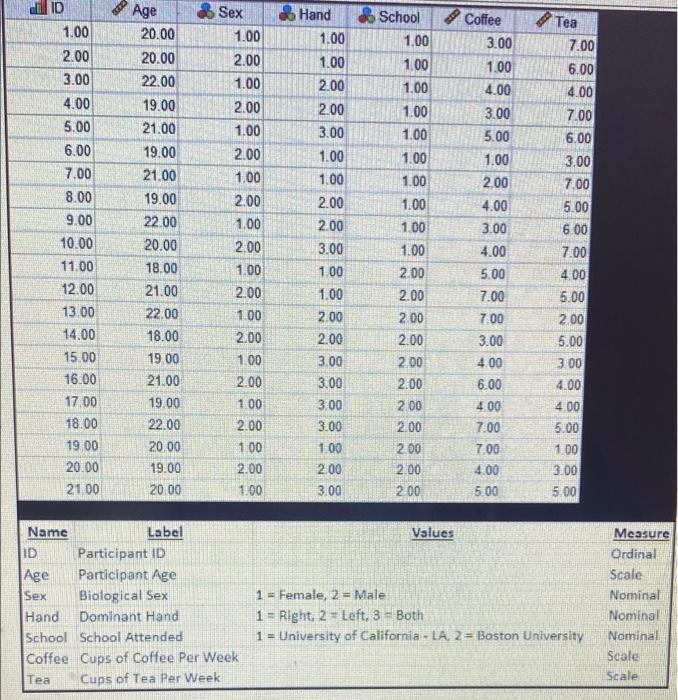
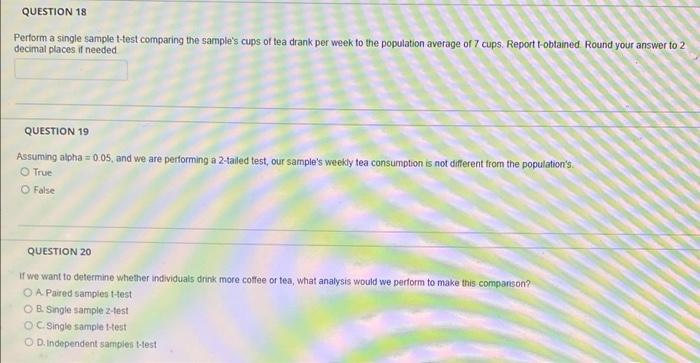
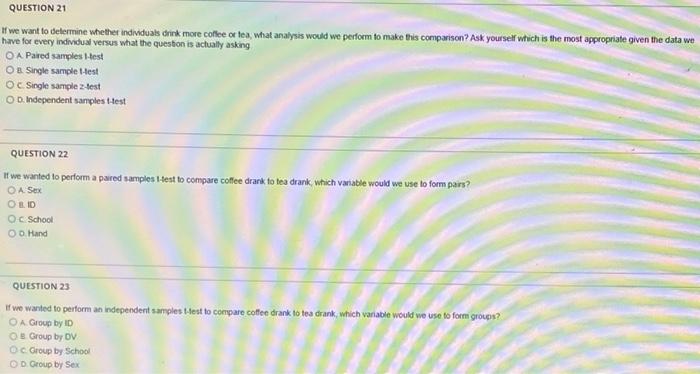
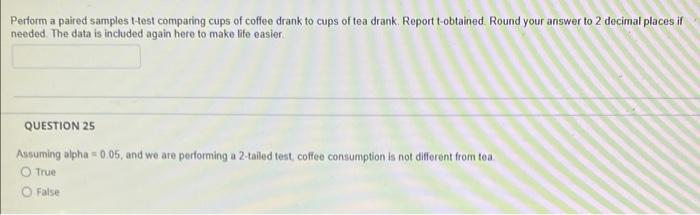
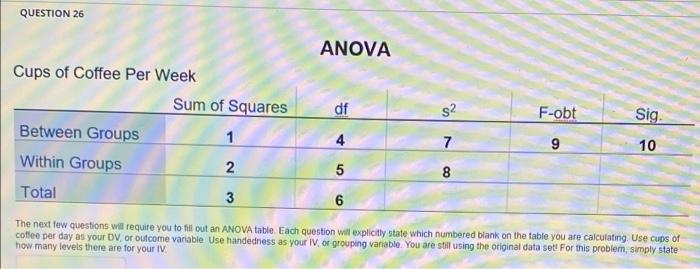
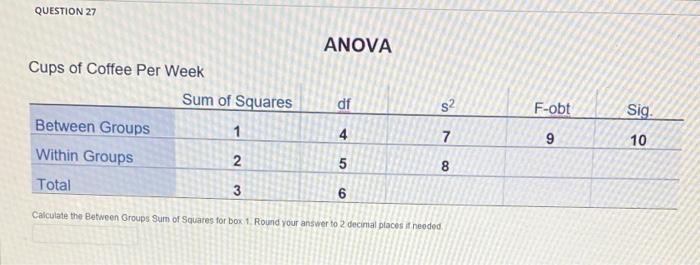
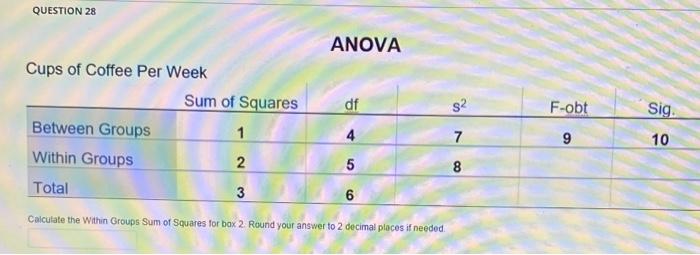
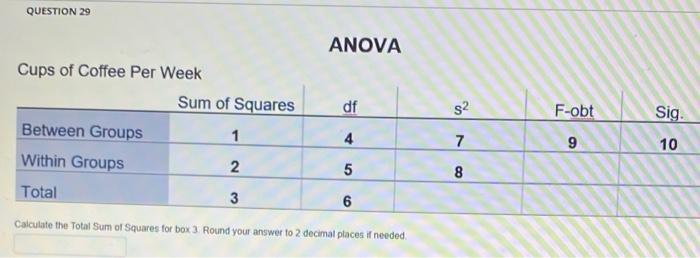
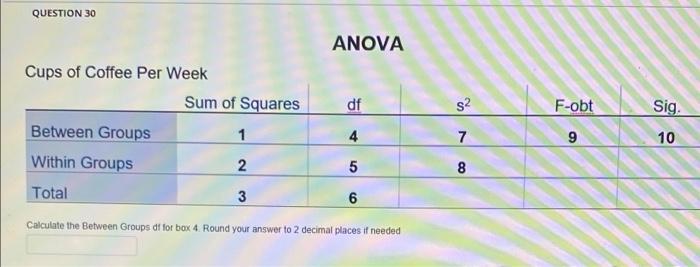
ID 1.00 2.00 3.00 4.00 5.00 6.00 7.00 8.00 9.00 10.00 11.00 12.00 13.00 14.00 15.00 16.00 17.00 18.00 19.00 20.00 21.00 CATE Age 20.00 20.00 22.00 19.00 21.00 19.00 21.00 19.00 22.00 20.00 18.00 21.00 22.00 18.00 19,00 21.00 19.00 22.00 20.00 19.00 20.00 Label Sex 1.00 2.00 1.00 2.00 1.00 2.00 1.00 2.00 1.00 2.00 1.00 2.00 1.00 2.00 1.00 2.00 1.00 2.00 1.00 2.00 1.00 Name ID Participant ID Age Participant Age Sex Biological Sex Hand Dominant Hand School School Attended Coffee Cups of Coffee Per Week Tea Cups of Tea Per Week Hand School Coffee 1.00 1.00 1.00 1.00 1.00 1.00 1.00 1.00 1.00 1.00 2.00 2.00 2.00 2.00 2.00 2.00 2.00 2.00 2.00 2.00 2.00 1.00 1.00 2.00 2.00 3.00 1.00 1.00 2.00 2.00 3.00 1.00 1.00 2.00 2.00 3.00 3.00 3.00 3.00 1.00 2.00 3.00 1 = Female, 2 = Male 1- Right. 2 Left, 3 - Both 1 = University of California - LA, 2= Boston University Values Tea 3.00 1.00 4.00 3.00 5.00 1.00 2.00 4.00 3.00 4.00 5.00 7.00 7.00 3.00 4.00 6.00 4.00 7.00 7.00 4.00 5.00 7.00 6.00 4.00 7.00 6.00 3.00 7.00 5.00 6.00 7.00 4.00 5.00 2.00 5.00 3.00 4.00 4.00 5.00 1.00 3.00 5.00 Measure Ordinal Scale Nominal Nominal Nominal Scale Scale QUESTION 18 Perform a single sample t-test comparing the sample's cups of tea drank per week to the population average of 7 cups. Report t-obtained Round your answer to 2 decimal places if needed QUESTION 19 Assuming alpha=0.05, and we are performing a 2-tailed test, our sample's weekly tea consumption is not different from the population's O True O False QUESTION 20 If we want to determine whether individuals drink more coffee or tea, what analysis would we perform to make this comparison? OA Paired samples t-test OB Single sample 2-test OC. Single sample t-test OD. Independent samples t-test QUESTION 21 If we want to determine whether individuals drink more coffee or tea, what analysis would we perform to make this comparison? Ask yourself which is the most appropriate given the data we have for every individual versus what the question is actually asking OA Paired samples 1-test OB Single sample t-test OC. Single sample 2-test OD. Independent samples t-test QUESTION 22 If we wanted to perform a paired samples 1-test to compare coffee drank to tea drank, which variable would we use to form pairs? OA. Sex OBID OC. School Oo. Hand QUESTION 23 If we wanted to perform an independent samples t-test to compare coffee drank to tea drank, which variable would we use to form groups? OA Group by ID OB Group by DV Oc Group by School OD. Group by Sex Perform a paired samples t-test comparing cups of coffee drank to cups of tea drank. Report t-obtained. Round your answer to 2 decimal places if needed. The data is included again here to make life easier. QUESTION 25 Assuming alpha=0.05, and we are performing a 2-tailed test, coffee consumption is not different from tea. O True O False QUESTION 26 ANOVA Cups of Coffee Per Week Sum of Squares df s F-obt Sig. Between Groups 1 4 7 9 10 Within Groups 2 5 8 Total 3 6 The next few questions will require you to fill out an ANOVA table. Each question will explicitly state which numbered blank on the table you are calculating Use cups of coffee per day as your DV, or outcome variable Use handedness as your IV, or grouping variable. You are still using the original data set! For this problem, simply state how many levels there are for your IV QUESTION 27 Cups of Coffee Per Week Sum of Squares s Between Groups 1 7 Within Groups 2 5 8 Total 3 6 Calculate the Between Groups Sum of Squares for box 1. Round your answer to 2 decimal places it needed. ANOVA df 4 F-obt 9 Sig. 10 QUESTION 28 ANOVA Cups of Coffee Per Week Sum of Squares df Between Groups 1 7 Within Groups 2 5 8 Total 3 6 Calculate the Within Groups Sum of Squares for bax 2. Round your answer to 2 decimal places if needed. 8 F-obt 9 Sig. 10 QUESTION 29 ANOVA Cups of Coffee Per Week Sum of Squares df Between Groups 1 4 Within Groups 2 5 Total 3 6 Calculate the Total Sum of Squares for box 3. Round your answer to 2 decimal places if needed. $ 7 8 F-obt 9 Sig. 10 QUESTION 30 ANOVA Cups of Coffee Per Week Sum of Squares df Between Groups 1 4 Within Groups 2 5 Total 3 6 Calculate the Between Groups df for bax 4. Round your answer to 2 decimal places if needed s 7 8 F-obt 9 Sig. 10 ID 1.00 2.00 3.00 4.00 5.00 6.00 7.00 8.00 9.00 10.00 11.00 12.00 13.00 14.00 15.00 16.00 17.00 18.00 19.00 20.00 21.00 CATE Age 20.00 20.00 22.00 19.00 21.00 19.00 21.00 19.00 22.00 20.00 18.00 21.00 22.00 18.00 19,00 21.00 19.00 22.00 20.00 19.00 20.00 Label Sex 1.00 2.00 1.00 2.00 1.00 2.00 1.00 2.00 1.00 2.00 1.00 2.00 1.00 2.00 1.00 2.00 1.00 2.00 1.00 2.00 1.00 Name ID Participant ID Age Participant Age Sex Biological Sex Hand Dominant Hand School School Attended Coffee Cups of Coffee Per Week Tea Cups of Tea Per Week Hand School Coffee 1.00 1.00 1.00 1.00 1.00 1.00 1.00 1.00 1.00 1.00 2.00 2.00 2.00 2.00 2.00 2.00 2.00 2.00 2.00 2.00 2.00 1.00 1.00 2.00 2.00 3.00 1.00 1.00 2.00 2.00 3.00 1.00 1.00 2.00 2.00 3.00 3.00 3.00 3.00 1.00 2.00 3.00 1 = Female, 2 = Male 1- Right. 2 Left, 3 - Both 1 = University of California - LA, 2= Boston University Values Tea 3.00 1.00 4.00 3.00 5.00 1.00 2.00 4.00 3.00 4.00 5.00 7.00 7.00 3.00 4.00 6.00 4.00 7.00 7.00 4.00 5.00 7.00 6.00 4.00 7.00 6.00 3.00 7.00 5.00 6.00 7.00 4.00 5.00 2.00 5.00 3.00 4.00 4.00 5.00 1.00 3.00 5.00 Measure Ordinal Scale Nominal Nominal Nominal Scale Scale QUESTION 18 Perform a single sample t-test comparing the sample's cups of tea drank per week to the population average of 7 cups. Report t-obtained Round your answer to 2 decimal places if needed QUESTION 19 Assuming alpha=0.05, and we are performing a 2-tailed test, our sample's weekly tea consumption is not different from the population's O True O False QUESTION 20 If we want to determine whether individuals drink more coffee or tea, what analysis would we perform to make this comparison? OA Paired samples t-test OB Single sample 2-test OC. Single sample t-test OD. Independent samples t-test QUESTION 21 If we want to determine whether individuals drink more coffee or tea, what analysis would we perform to make this comparison? Ask yourself which is the most appropriate given the data we have for every individual versus what the question is actually asking OA Paired samples 1-test OB Single sample t-test OC. Single sample 2-test OD. Independent samples t-test QUESTION 22 If we wanted to perform a paired samples 1-test to compare coffee drank to tea drank, which variable would we use to form pairs? OA. Sex OBID OC. School Oo. Hand QUESTION 23 If we wanted to perform an independent samples t-test to compare coffee drank to tea drank, which variable would we use to form groups? OA Group by ID OB Group by DV Oc Group by School OD. Group by Sex Perform a paired samples t-test comparing cups of coffee drank to cups of tea drank. Report t-obtained. Round your answer to 2 decimal places if needed. The data is included again here to make life easier. QUESTION 25 Assuming alpha=0.05, and we are performing a 2-tailed test, coffee consumption is not different from tea. O True O False QUESTION 26 ANOVA Cups of Coffee Per Week Sum of Squares df s F-obt Sig. Between Groups 1 4 7 9 10 Within Groups 2 5 8 Total 3 6 The next few questions will require you to fill out an ANOVA table. Each question will explicitly state which numbered blank on the table you are calculating Use cups of coffee per day as your DV, or outcome variable Use handedness as your IV, or grouping variable. You are still using the original data set! For this problem, simply state how many levels there are for your IV QUESTION 27 Cups of Coffee Per Week Sum of Squares s Between Groups 1 7 Within Groups 2 5 8 Total 3 6 Calculate the Between Groups Sum of Squares for box 1. Round your answer to 2 decimal places it needed. ANOVA df 4 F-obt 9 Sig. 10 QUESTION 28 ANOVA Cups of Coffee Per Week Sum of Squares df Between Groups 1 7 Within Groups 2 5 8 Total 3 6 Calculate the Within Groups Sum of Squares for bax 2. Round your answer to 2 decimal places if needed. 8 F-obt 9 Sig. 10 QUESTION 29 ANOVA Cups of Coffee Per Week Sum of Squares df Between Groups 1 4 Within Groups 2 5 Total 3 6 Calculate the Total Sum of Squares for box 3. Round your answer to 2 decimal places if needed. $ 7 8 F-obt 9 Sig. 10 QUESTION 30 ANOVA Cups of Coffee Per Week Sum of Squares df Between Groups 1 4 Within Groups 2 5 Total 3 6 Calculate the Between Groups df for bax 4. Round your answer to 2 decimal places if needed s 7 8 F-obt 9 Sig. 10 Step by Step Solution
There are 3 Steps involved in it
Step: 1

Get Instant Access to Expert-Tailored Solutions
See step-by-step solutions with expert insights and AI powered tools for academic success
Step: 2

Step: 3
Ace Your Homework with AI
Get the answers you need in no time with our AI-driven, step-by-step assistance
Get Started
Analysing Financial Performance Using Integrated Ratio Analysis
Authors: Nic La Rosa
1st Edition
0367552523, 978-0367552527