

Answered step by step
Verified Expert Solution
Question
1 Approved Answer
Use the data shown in the following table: a. Compute the average return for each of the assets from 1929 to 1940 (the Great Depression).
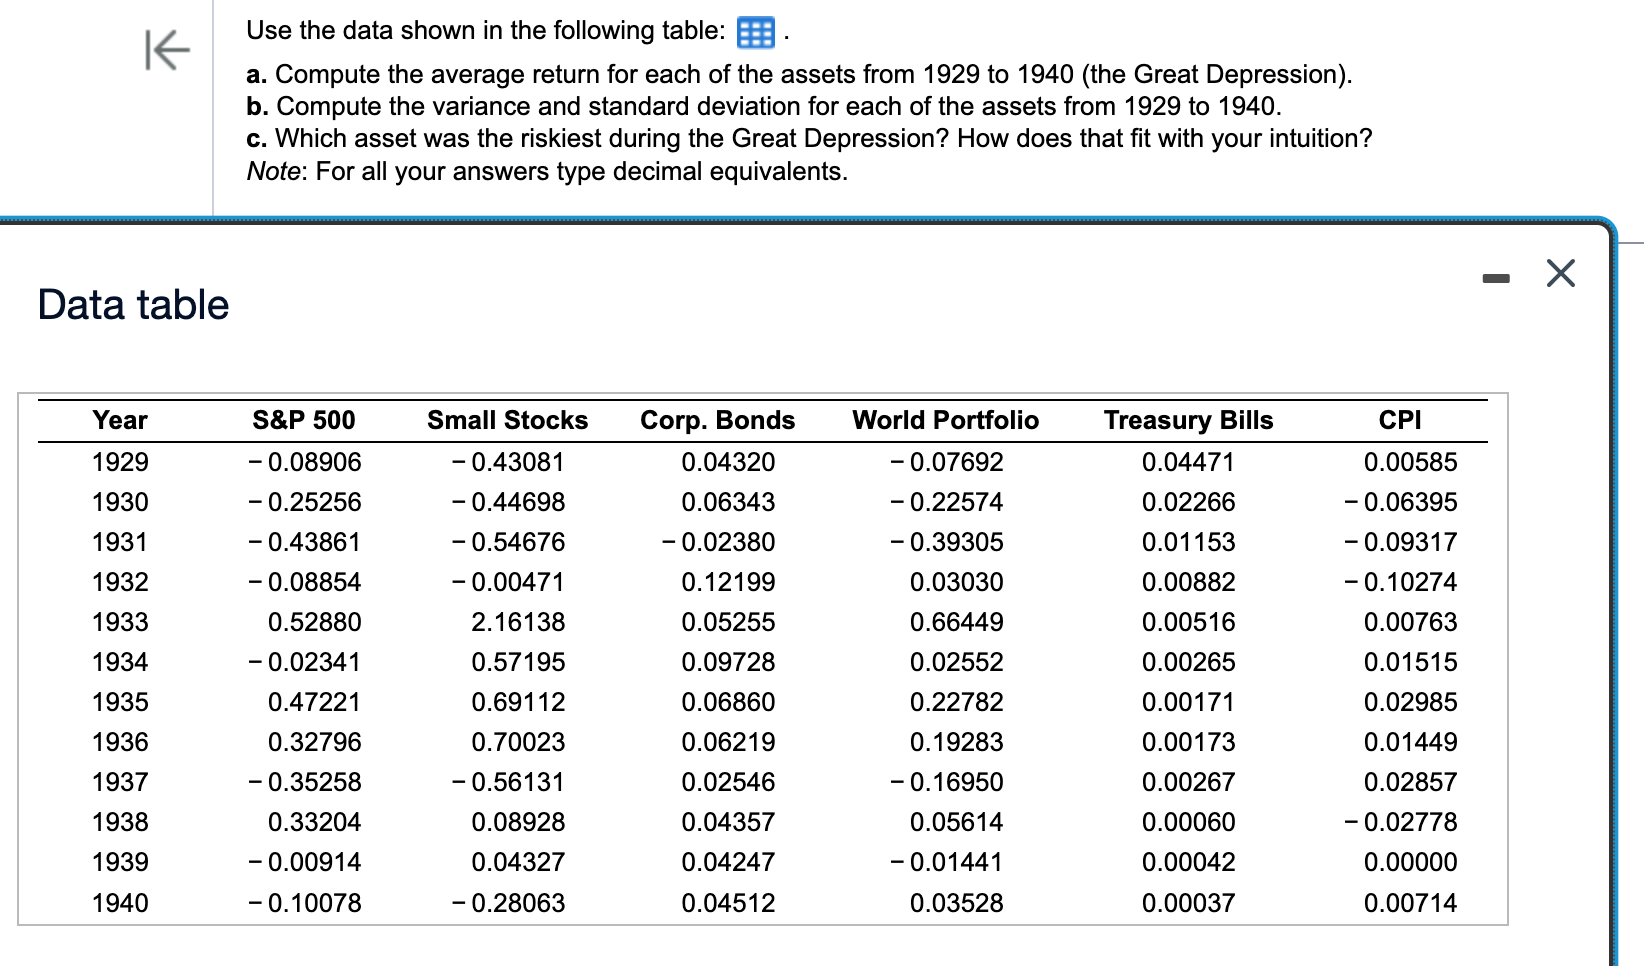 Use the data shown in the following table: a. Compute the average return for each of the assets from 1929 to 1940 (the Great Depression). b. Compute the variance and standard deviation for each of the assets from 1929 to 1940 . c. Which asset was the riskiest during the Great Depression? How does that fit with your intuition? Note: For all your answers type decimal equivalents. Data table
 Step by Step Solution
There are 3 Steps involved in it
Step: 1

Get Instant Access to Expert-Tailored Solutions
See step-by-step solutions with expert insights and AI powered tools for academic success
Step: 2

Step: 3
Ace Your Homework with AI
Get the answers you need in no time with our AI-driven, step-by-step assistance
Get Started
Rockin Your Business Finances
Authors: Chrstine Odle
1st Edition
0999135104, 9780999135105