

Question
Use the data you created in your W1 Midweek Assignment for this assignment. Using Microsoft Excel and following the instructions given in your lecture, choose
Use the data you created in your W1 Midweek Assignment for this assignment.
Using Microsoft Excel and following the instructions given in your lecture, choose and run the appropriate descriptive statistics (graphic and numerical) to describe the sample's age, sex, height, and year in college.
Copy your output tables and graphs to a Microsoft Word document and write a brief (1-paragraph), APA formatted report detailing your findings in the same document as the output. Model your write-up and interpretation on the example given in the lecture on Interpreting Data.
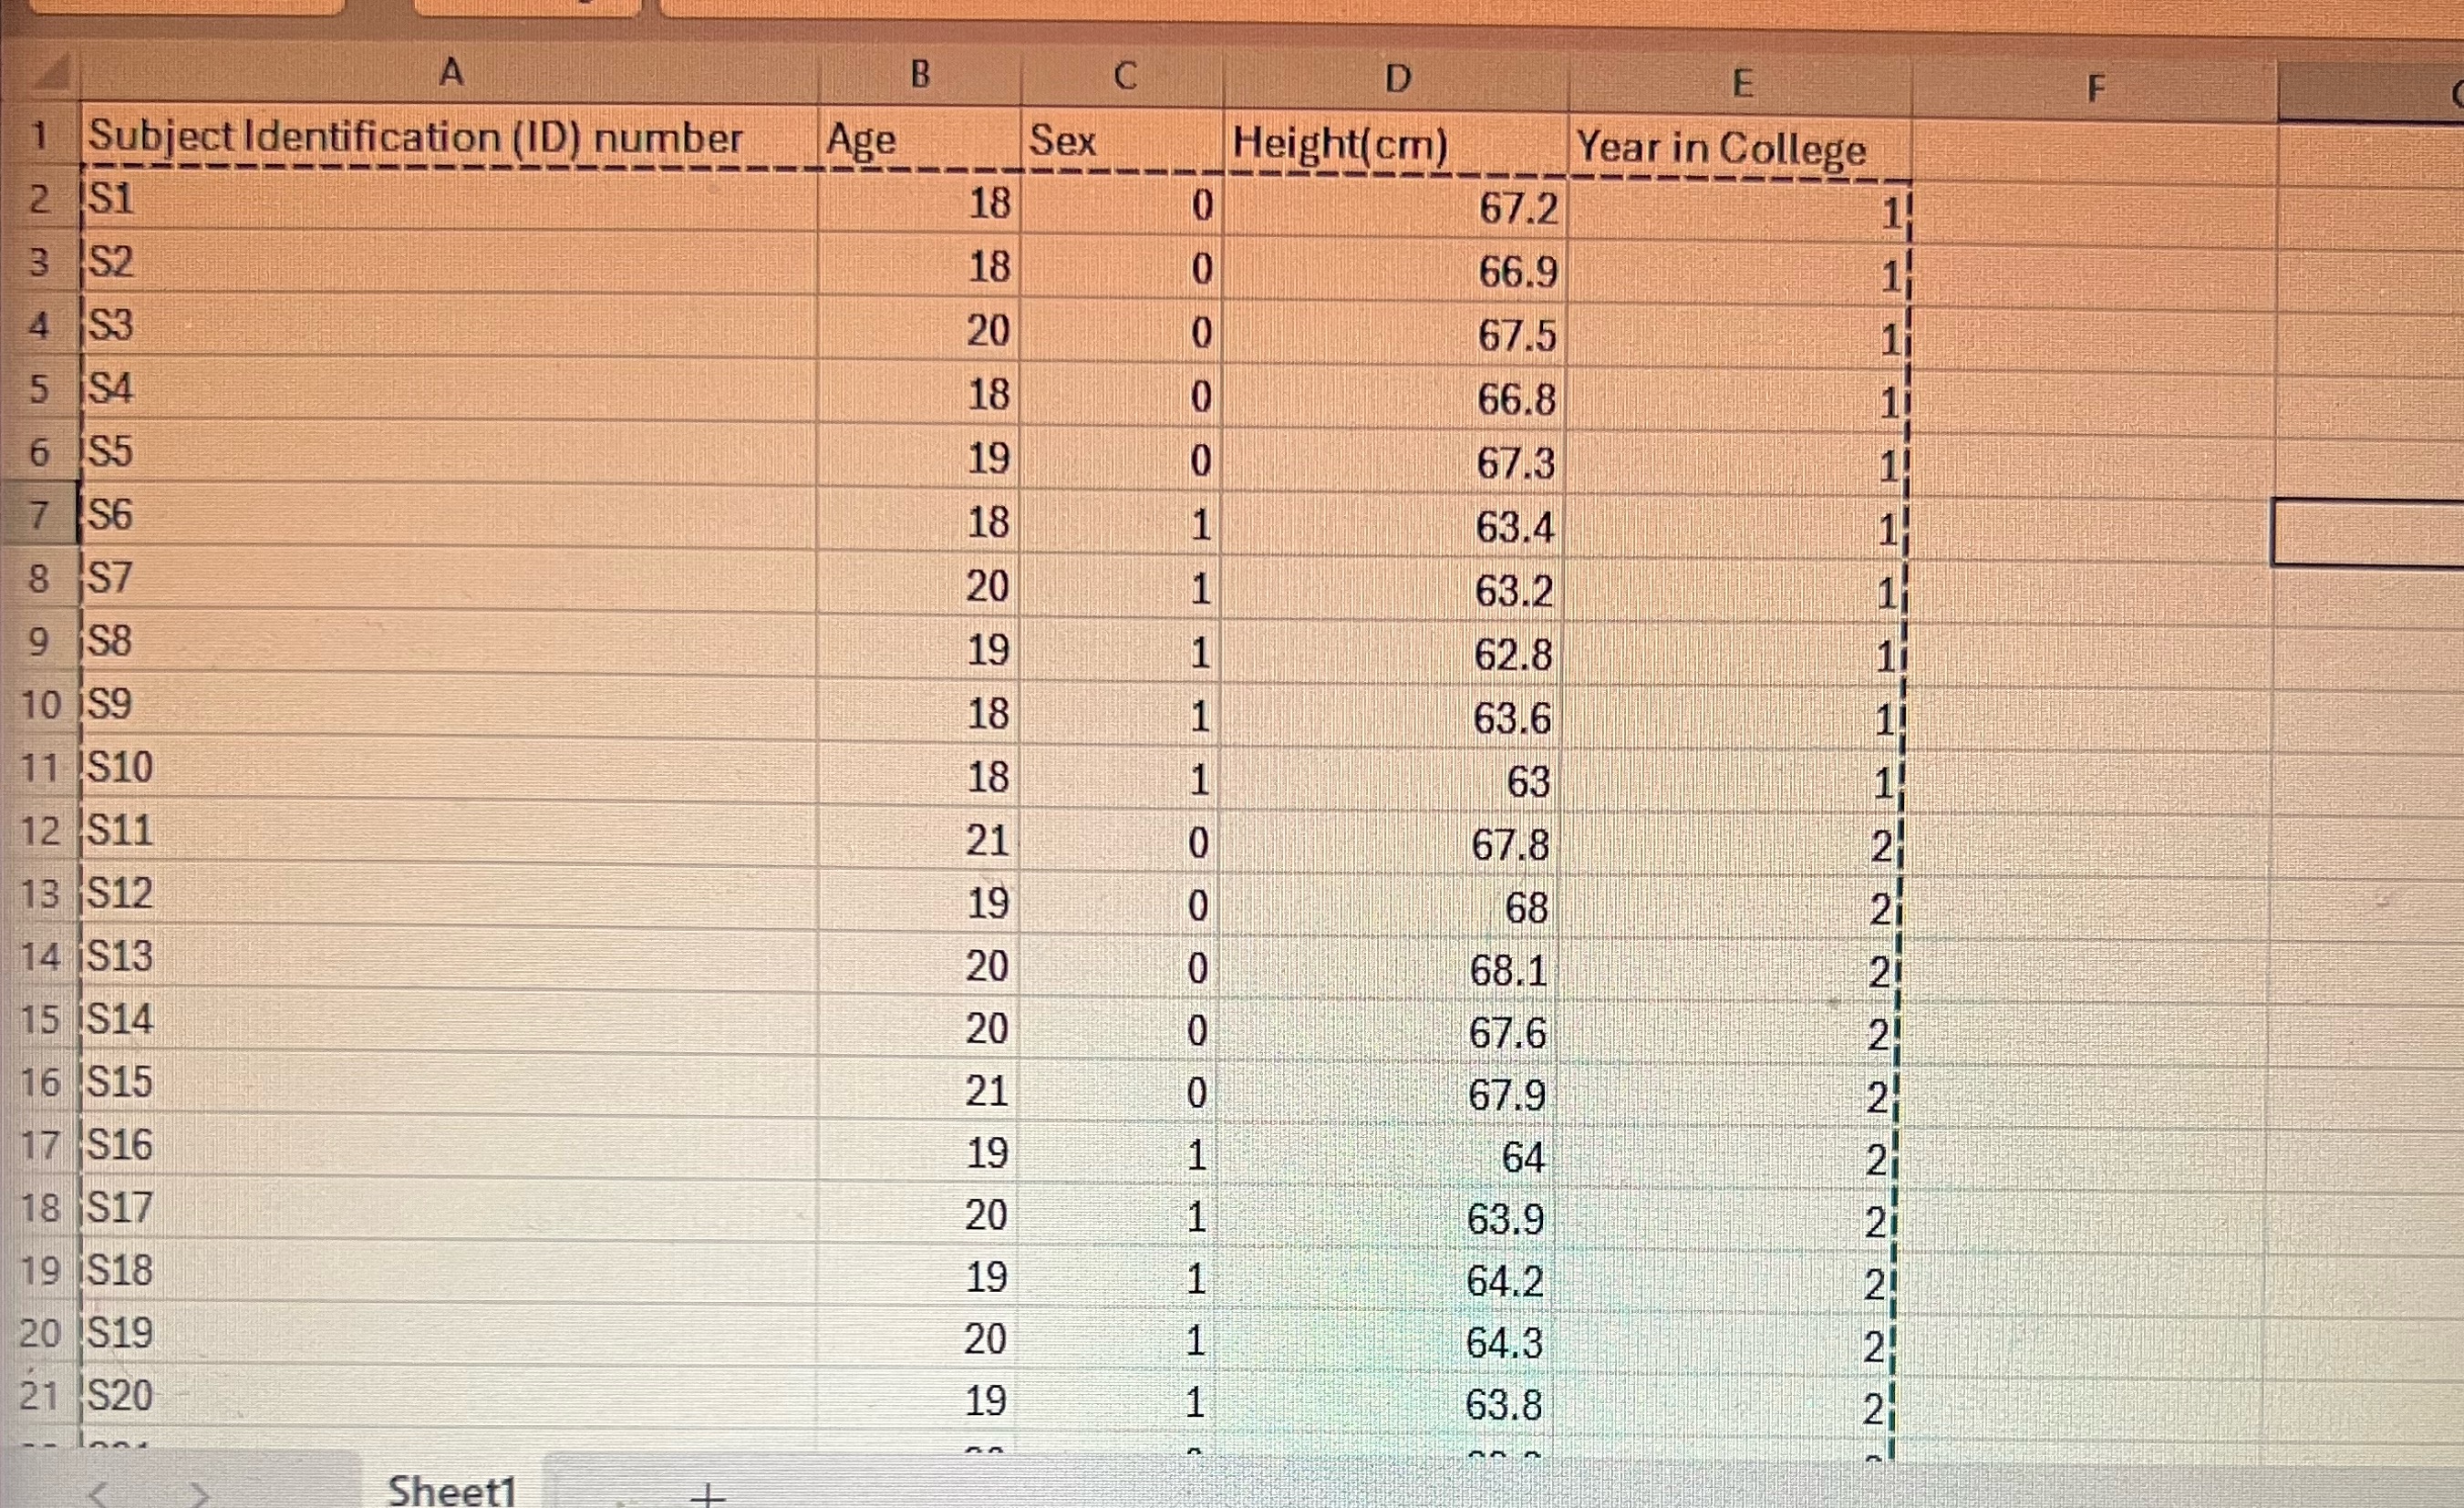
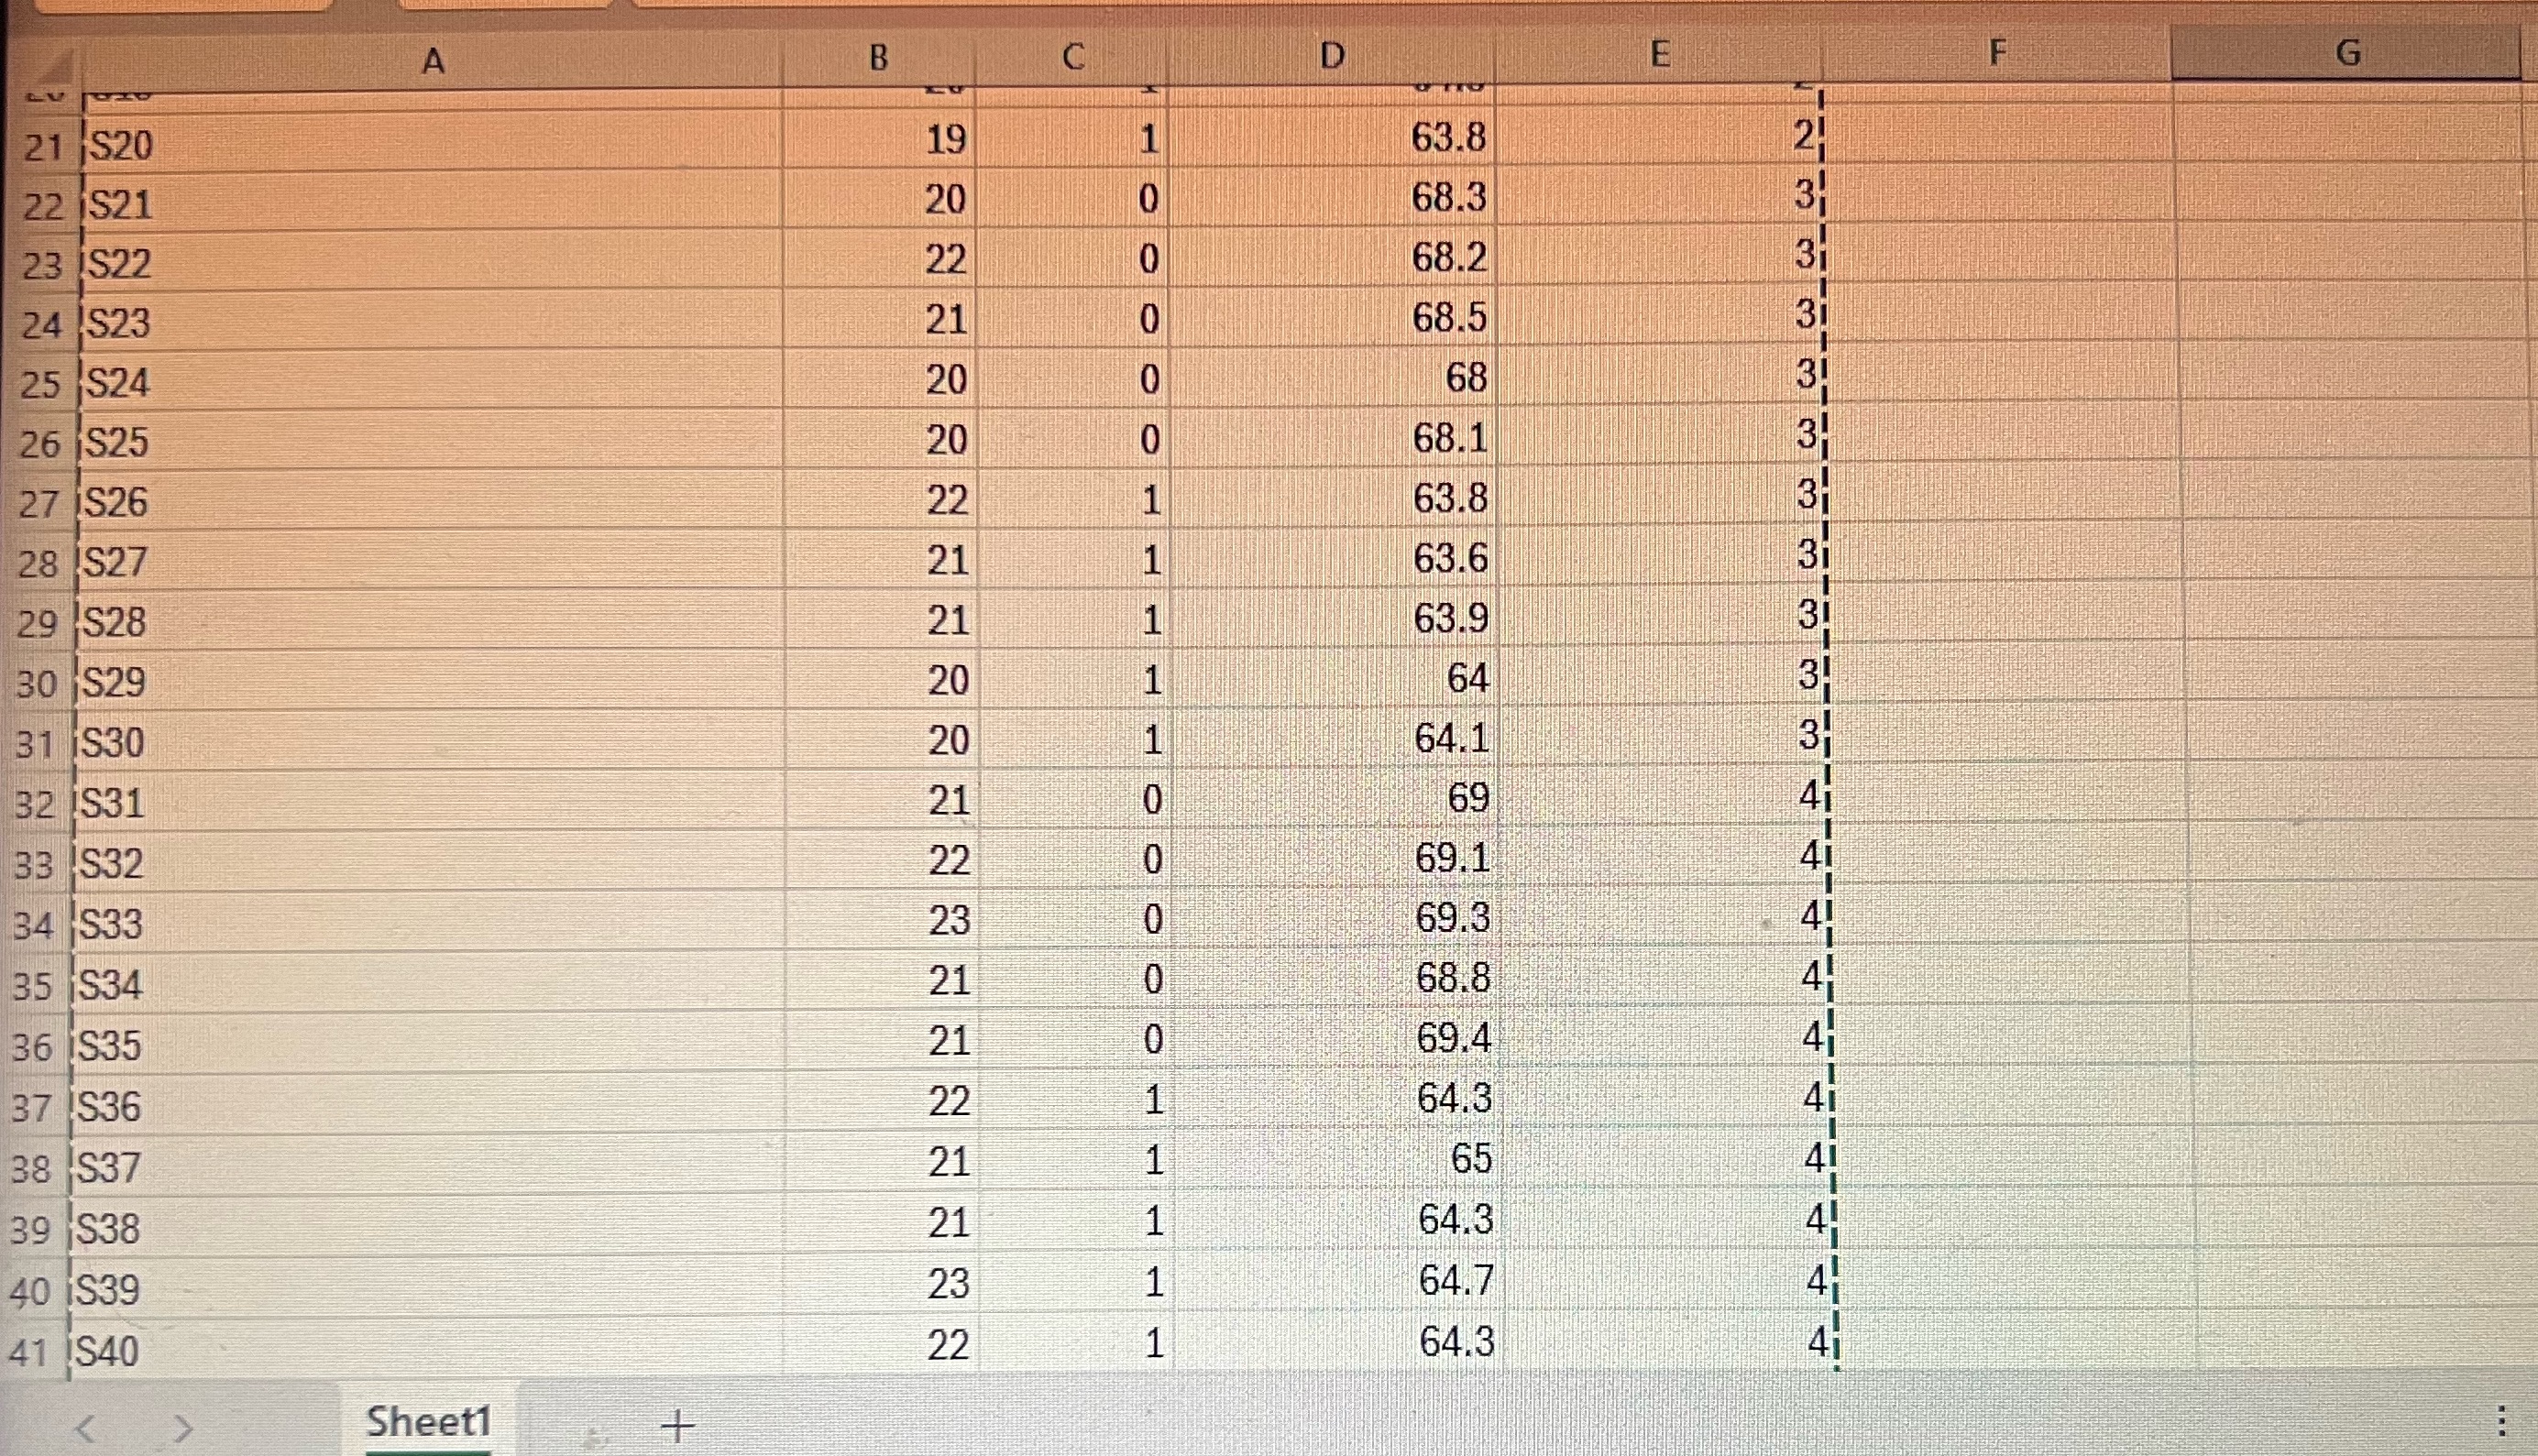
This is the DATA from the Week 1 Assignment.
Step by Step Solution
There are 3 Steps involved in it
Step: 1

Get Instant Access to Expert-Tailored Solutions
See step-by-step solutions with expert insights and AI powered tools for academic success
Step: 2

Step: 3
Ace Your Homework with AI
Get the answers you need in no time with our AI-driven, step-by-step assistance
Get Started
Differential Equations and Linear Algebra
Authors: Jerry Farlow, James E. Hall, Jean Marie McDill, Beverly H. West
2nd edition
131860615, 978-0131860612