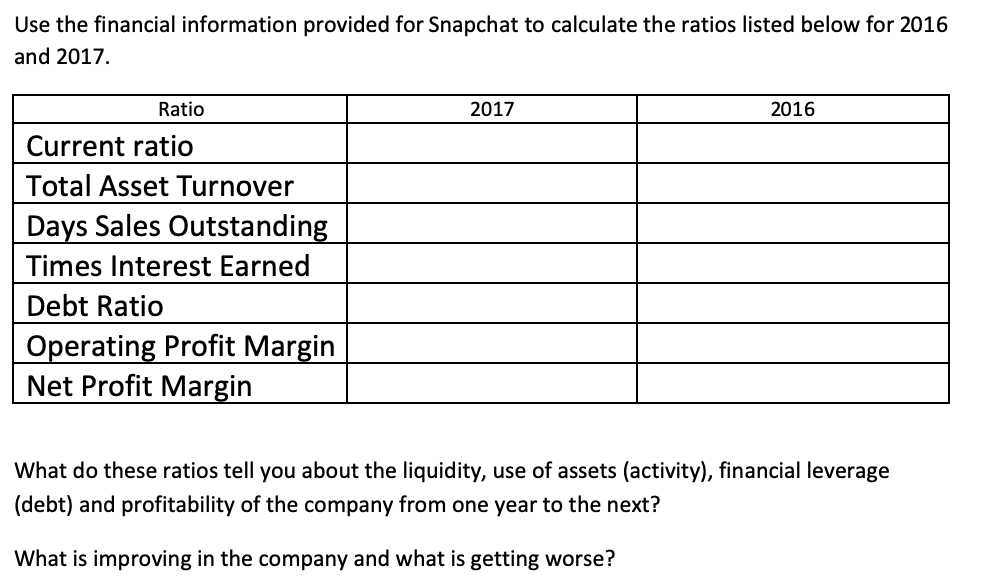
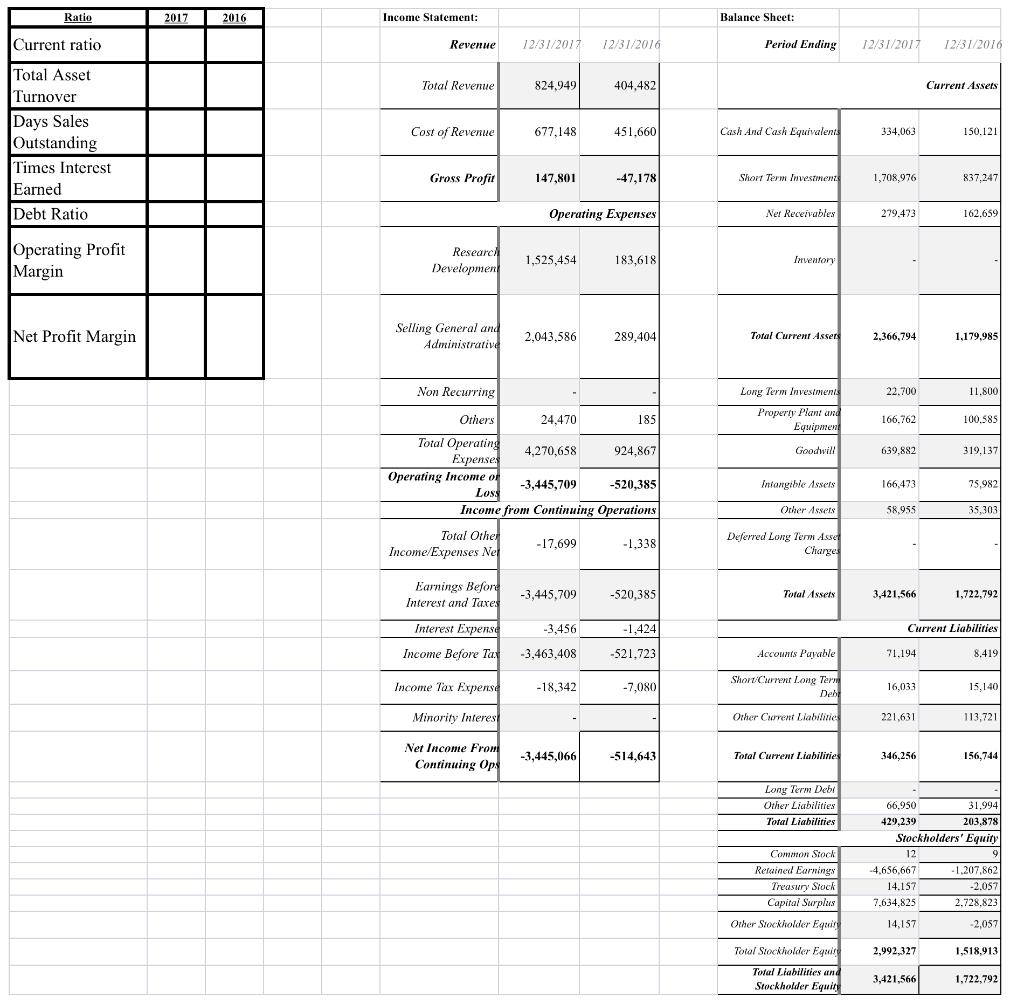
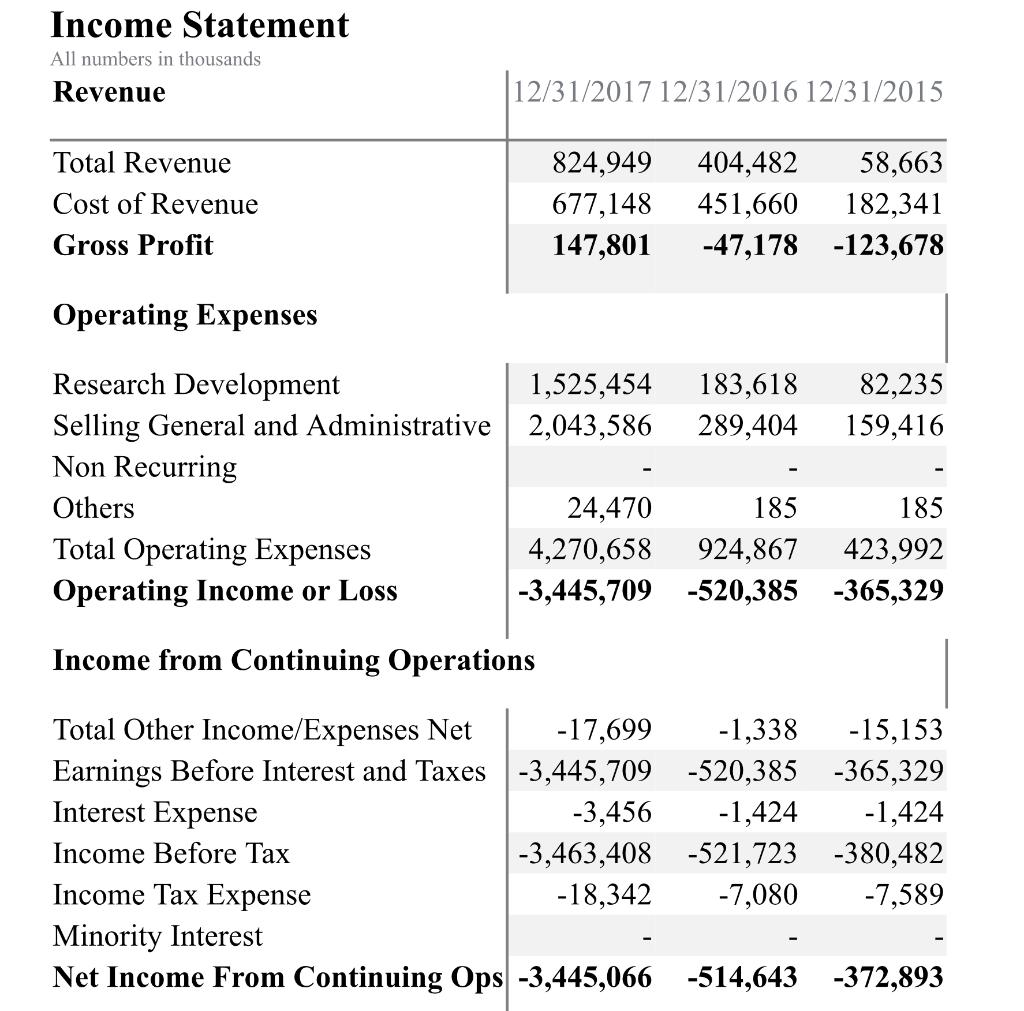
Use the financial information provided for Snapchat to calculate the ratios listed below for 2016 and 2017. Ratio 2017 2016 Current ratio Total Asset Turnover Days Sales Outstanding Times Interest Earned Debt Ratio Operating Profit Margin Net Profit Margin What do these ratios tell you about the liquidity, use of assets (activity), financial leverage (debt) and profitability of the company from one year to the next? What is improving in the company and what is getting worse? Ratio 2017 2016 Income Statement: Balance Sheet: Current ratio Revenue 12/31/2017 12/31/2016 Period Ending 12/31/2017 12/31/2016 Total Revenue 824,949 404,482 Current Assets Cost of Revenue 677,148 451,660 Cash And Cash Equivalents 334.063 150.121 Total Asset Turnover Days Sales Outstanding Times Interest Earned Debt Ratio Gross Profit 147,801 -47,178 Short Term Investment 1,708,976 837,247 Operating Expenses Ner Receivables 279.473 162.659 Operating Profit Margin Researca Development 1,525,454 183,618 Inventory Net Profit Margin Selling General and Administrative 2,043,586 289,404 Total Current Assers 2,366,794 1,179,985 Non Recurring 22.700 11.800 Long Term Investments Property Plant and Equipment 166,762 100,585 Goodwill 639,882 319,137 Others 24,470 185 Total Operating 4,270,658 924,867 Expenses Operating Income of -3,445,709 -520,385 Loss Income from Continuing Operations Total Other -17,699 Income/Expenses Nel -1,338 Intangible Assets 166,473 75.982 Other Assets 58,955 35,303 Deferred Long Term Asset Charges Earnings Before Interest and Taxes -3,445,709 -520,385 Total Assets 3,421,566 1,722,792 Interest Expenso -3,456 -1,424 Current Liabilities Income Before Tax -3,463,408 -521.723 Accounts Payable 71.194 8.419 Income Tax Expense -18,342 -7,080 Short Current Long Term Dehe 16,033 15,140 Minority Interese Other Current Liabilities 221,631 113,721 Net Income From Continuing Ops -3,445,066 -514,643 Total Current L.labilities 346,256 156,744 Long Term Debi Other Liabilities Total Liabilities Common Stock Retained Earnings Treasury Stock Capital Surplus Other Stockholder Eguir 66.950 31.994 429,239 203.878 Stockholders' Equity 12 9 -4.656,667 - 1.207.862 14.157 -2.057 7,634,825 2.728,823 14,157 -2,057 2,992,327 1,518.913 Total Stockholder Eguir Total Liabilities and Stockholder Equity 3,421,566 1,722,792 Income Statement All numbers in thousands Revenue 12/31/2017 12/31/2016 12/31/2015 Total Revenue Cost of Revenue Gross Profit 824,949 677,148 147,801 404,482 58,663 451,660 182,341 -47,178 -123,678 Operating Expenses Research Development 1,525,454 183,618 82,235 Selling General and Administrative 2,043,586 289,404 159,416 Non Recurring Others 24,470 185 185 Total Operating Expenses 4,270,658 924,867 423,992 Operating Income or Loss -3,445,709 -520,385 -365,329 Income from Continuing Operations Total Other Income/Expenses Net -17,699 -1,338 -15,153 Earnings Before Interest and Taxes -3,445,709-520,385 -365,329 Interest Expense -3,456 -1,424 -1,424 Income Before Tax -3,463,408 -521,723 -380,482 Income Tax Expense -18,342 -7,080 -7,589 Minority Interest Net Income From Continuing Ops -3,445,066 -514,643 -372,893