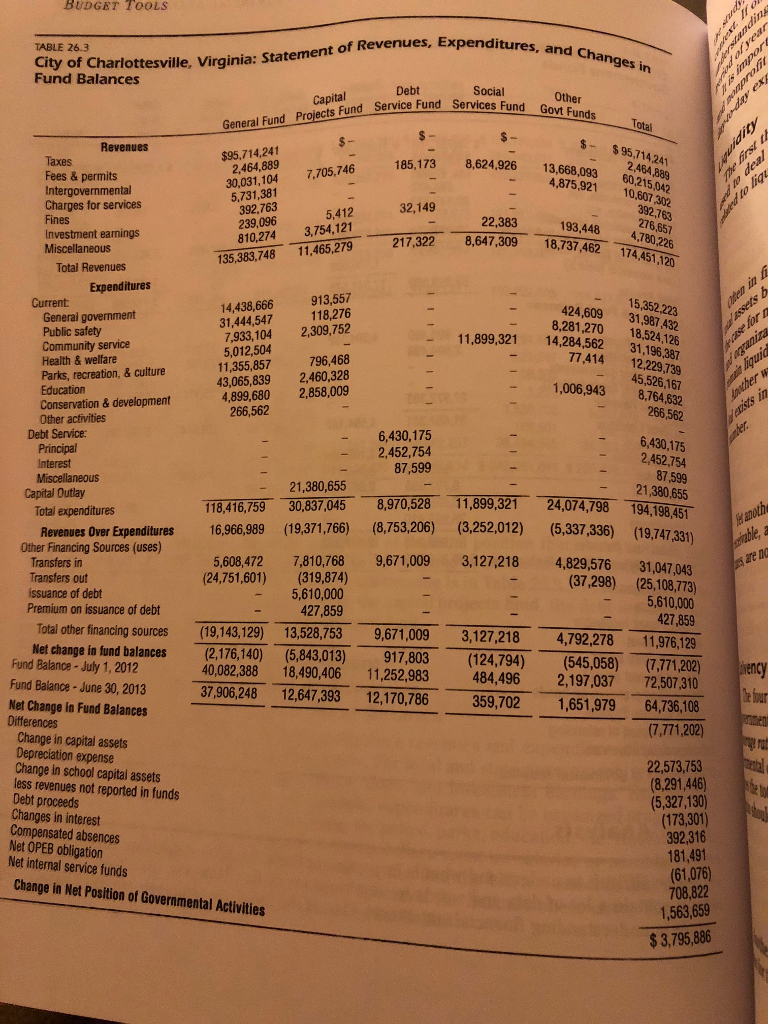
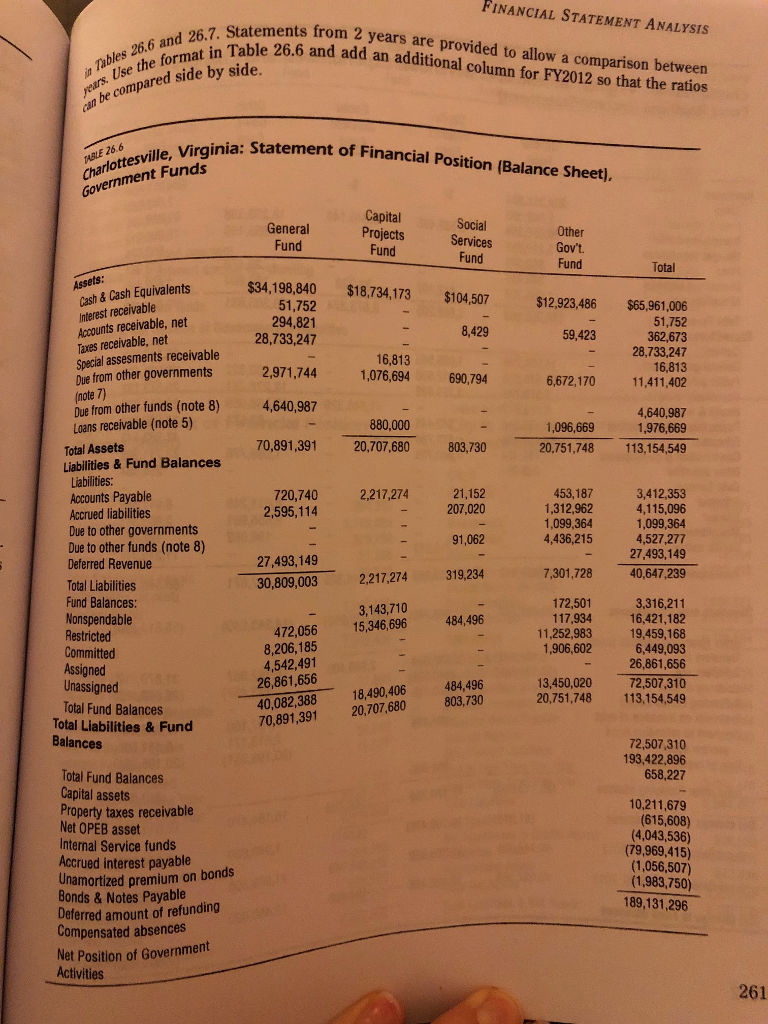
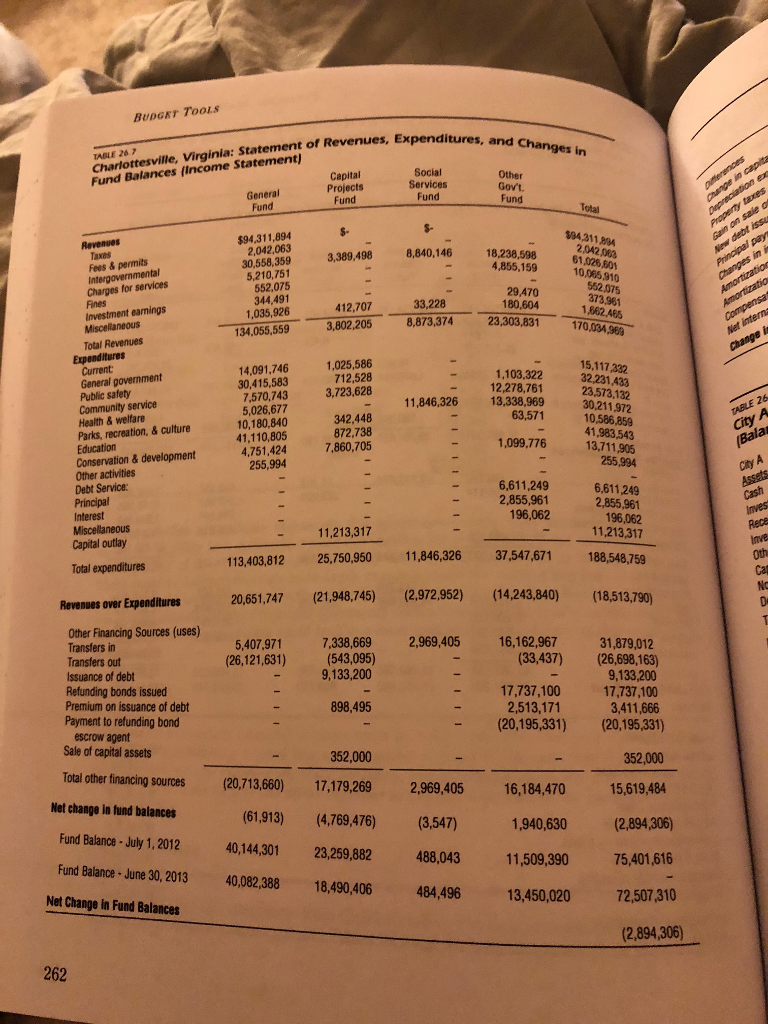
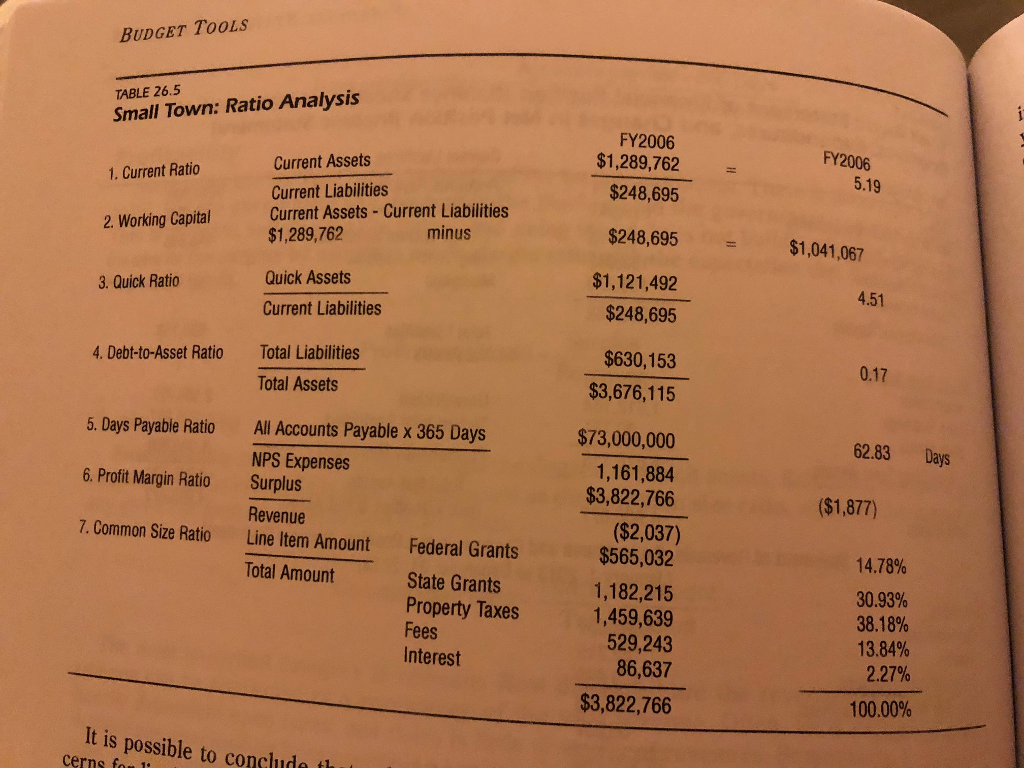
Use the financial statements from Charlottesville, Virginia to conduct your own analysis. The Statement from the year 2013 is in table 26.2 and 26.3; the statement from 2012 is provided in tables 26.6 and 26.7. Statements from 2 years are provided to allow comparison betwen years. Use the Format in table 26.5 and add an additional column for FY2012 so that the ratios can be compared side by side. Show your work on an excel worksheet
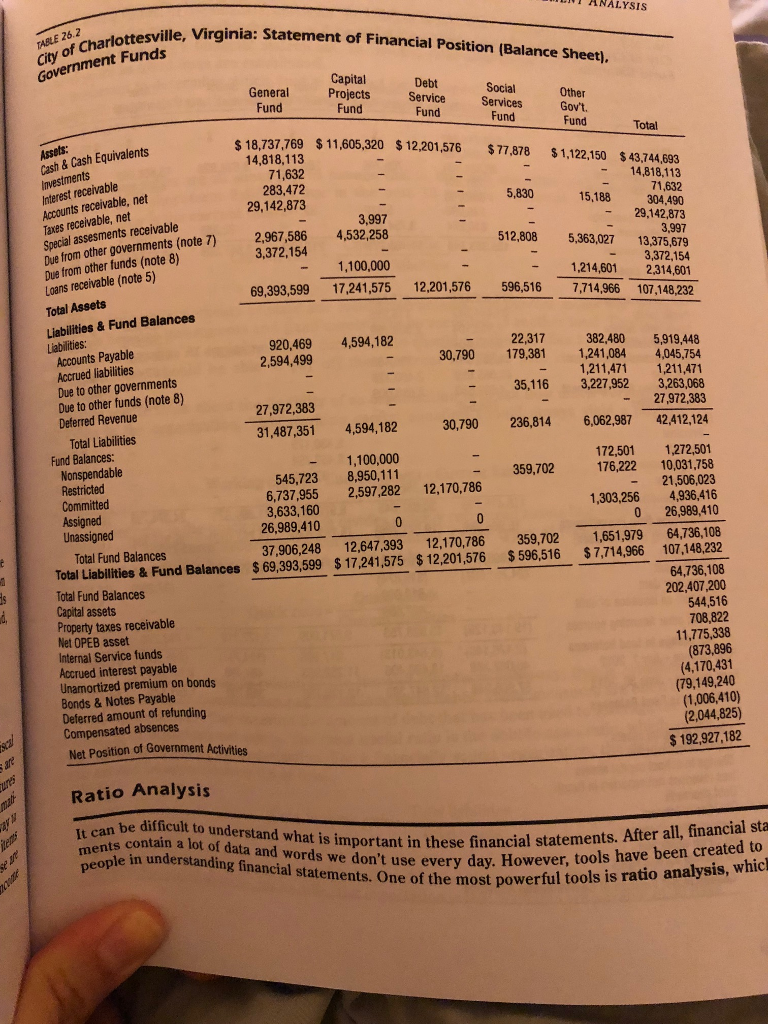
1 ANALYSIS sville, Virginia: Statement of Financial Position (Balance Sheet), Government Funds Capital Other General Projects Service Services Govt. Debt Social Fund Fund Fund Fund Fund s 18,737,769 $11,605,320 $12,201,576 $77,878 $1,122,150 $43,744,693 Total Cash & Cash Equivalents Investments Interest receivable Accounts receivable, net Taxes receivable, net 14,818,113 71 283,472 29,142,873 14,818,113 5.830 15,188 304,490 -29,142,873 3,997 4,532258 -1,100,000 Due from other governments (note 7) Due from other funds (note 8) Loans receivable (note 5) Total Assets Liabilities &Fund Balances Liabilities 2,967,586 3,372,154 3,997 512,808 5,363,027 13,375,679 - 3,372,154 1,214,601 2,314,601 69,393,599 17,241,575 12,201,576 596,516 7,714,966 107,148,232 920,469 4,594,182 2,594,499 22.317 382 80 5,919,448 Accounts Payable Accrued liabilities Due to other governments Due to other funds (note 8) Deferred Revenue 30,790 179,381 1,241,084 4,045,754 1,211,471 1,211,471 - 35,116 3,227,952 3,263,068 27,972,383 31,487,351 4,594,182 30,790 236,814 6,062,987 42,412,124 27,972,383 Total Liabilities Fund Balances: 172,501 1,272,501 359,702 176,222 10,031,758 - 21,506,023 1,303,256 4,936,416 1,100,000 545,723 8,950,111 6,737,955 2,597,282 12,170,786 3,633,160 Committed Unassigned 26,989,410 0 26,989,410 Total Fund Balances Total Liabilities & Fund Balances Total Fund Balances Capital assets Property taxes receivable Net OPEB asset Internal Service funds Accrued interest payable Unamortized premium on bonds Bonds & Notes Payable Deferred amount of refunding 37,906,248 12,647,393 12,170,786 359,702 1,651,979 64,736,108 107,148,232 64,736,108 202,407,200 544,516 708,822 $ 69,393,599 17,241,575 12,201,576 $596,516 $7,714,966 (4,170,431 (79,149,240 (1,006,410) (2,044,825) Net Position of Government Activities Ratio Analysis ments contain a lot of data and important in these financial sta $192,927,182 be difficult to understand what is important in these ina oeyer, tools have beeiavsis, w ple in understanding financial statements. One of the most powerful tools 1S understand what is important in these financial statements. After all, tinan use every day. However, tools have been created to ratio analysis, whicl 1 ANALYSIS sville, Virginia: Statement of Financial Position (Balance Sheet), Government Funds Capital Other General Projects Service Services Govt. Debt Social Fund Fund Fund Fund Fund s 18,737,769 $11,605,320 $12,201,576 $77,878 $1,122,150 $43,744,693 Total Cash & Cash Equivalents Investments Interest receivable Accounts receivable, net Taxes receivable, net 14,818,113 71 283,472 29,142,873 14,818,113 5.830 15,188 304,490 -29,142,873 3,997 4,532258 -1,100,000 Due from other governments (note 7) Due from other funds (note 8) Loans receivable (note 5) Total Assets Liabilities &Fund Balances Liabilities 2,967,586 3,372,154 3,997 512,808 5,363,027 13,375,679 - 3,372,154 1,214,601 2,314,601 69,393,599 17,241,575 12,201,576 596,516 7,714,966 107,148,232 920,469 4,594,182 2,594,499 22.317 382 80 5,919,448 Accounts Payable Accrued liabilities Due to other governments Due to other funds (note 8) Deferred Revenue 30,790 179,381 1,241,084 4,045,754 1,211,471 1,211,471 - 35,116 3,227,952 3,263,068 27,972,383 31,487,351 4,594,182 30,790 236,814 6,062,987 42,412,124 27,972,383 Total Liabilities Fund Balances: 172,501 1,272,501 359,702 176,222 10,031,758 - 21,506,023 1,303,256 4,936,416 1,100,000 545,723 8,950,111 6,737,955 2,597,282 12,170,786 3,633,160 Committed Unassigned 26,989,410 0 26,989,410 Total Fund Balances Total Liabilities & Fund Balances Total Fund Balances Capital assets Property taxes receivable Net OPEB asset Internal Service funds Accrued interest payable Unamortized premium on bonds Bonds & Notes Payable Deferred amount of refunding 37,906,248 12,647,393 12,170,786 359,702 1,651,979 64,736,108 107,148,232 64,736,108 202,407,200 544,516 708,822 $ 69,393,599 17,241,575 12,201,576 $596,516 $7,714,966 (4,170,431 (79,149,240 (1,006,410) (2,044,825) Net Position of Government Activities Ratio Analysis ments contain a lot of data and important in these financial sta $192,927,182 be difficult to understand what is important in these ina oeyer, tools have beeiavsis, w ple in understanding financial statements. One of the most powerful tools 1S understand what is important in these financial statements. After all, tinan use every day. However, tools have been created to ratio analysis, whicl