Question
Use the Financial statements (numbers) provided for Wilmington Health for 2020 & 2021. respectively. ( 2. What is the Current Ratio for Wilmington Health for
Use the Financial statements (numbers) provided for Wilmington Health for 2020 & 2021. respectively. (
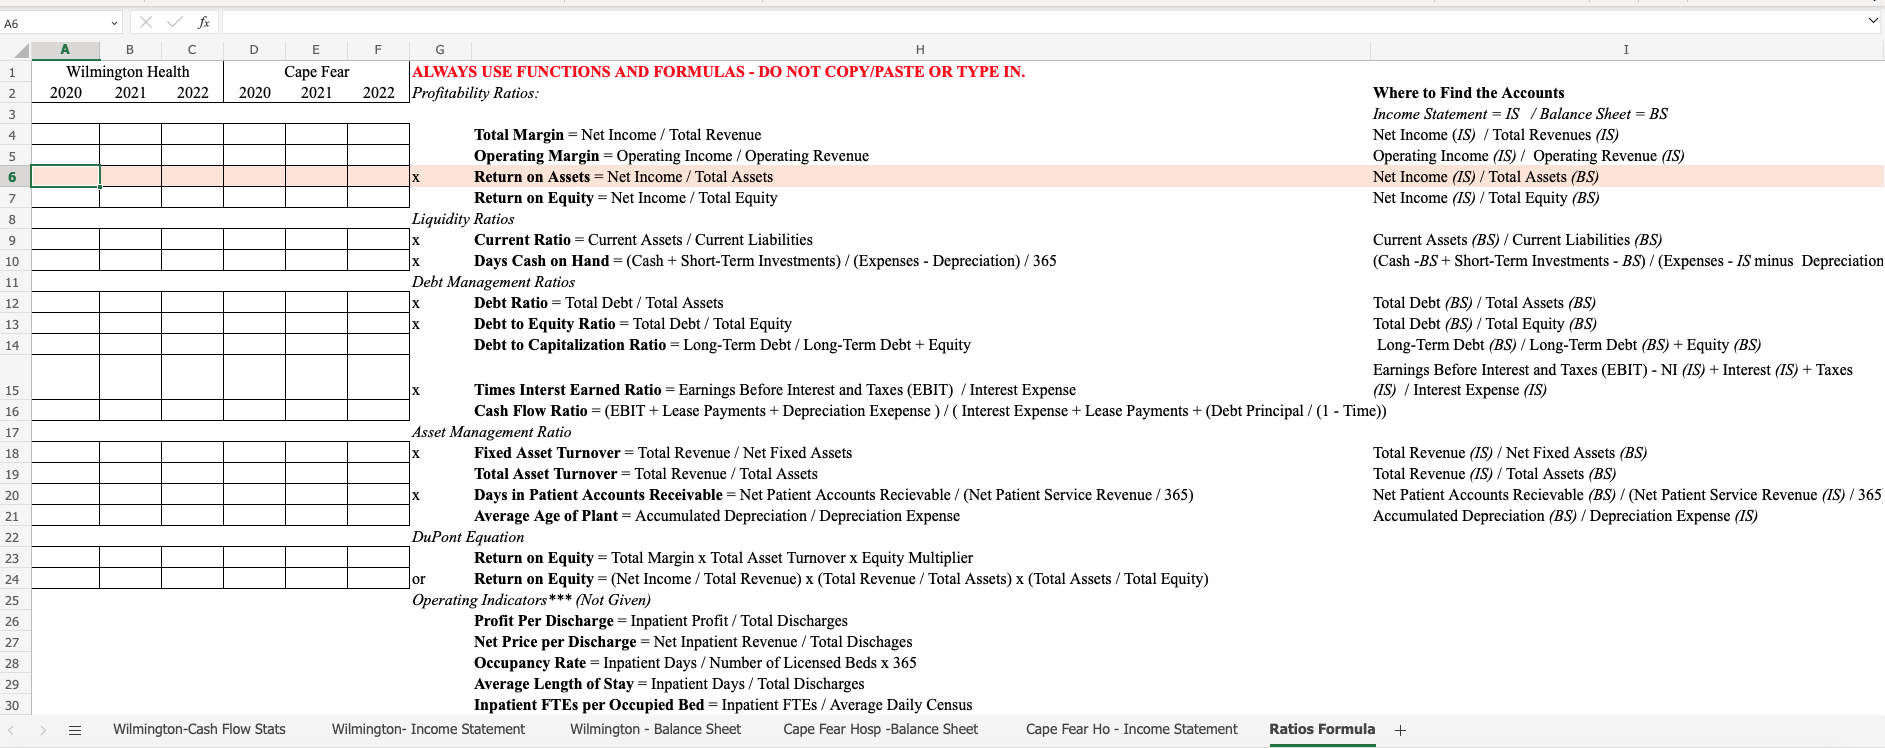
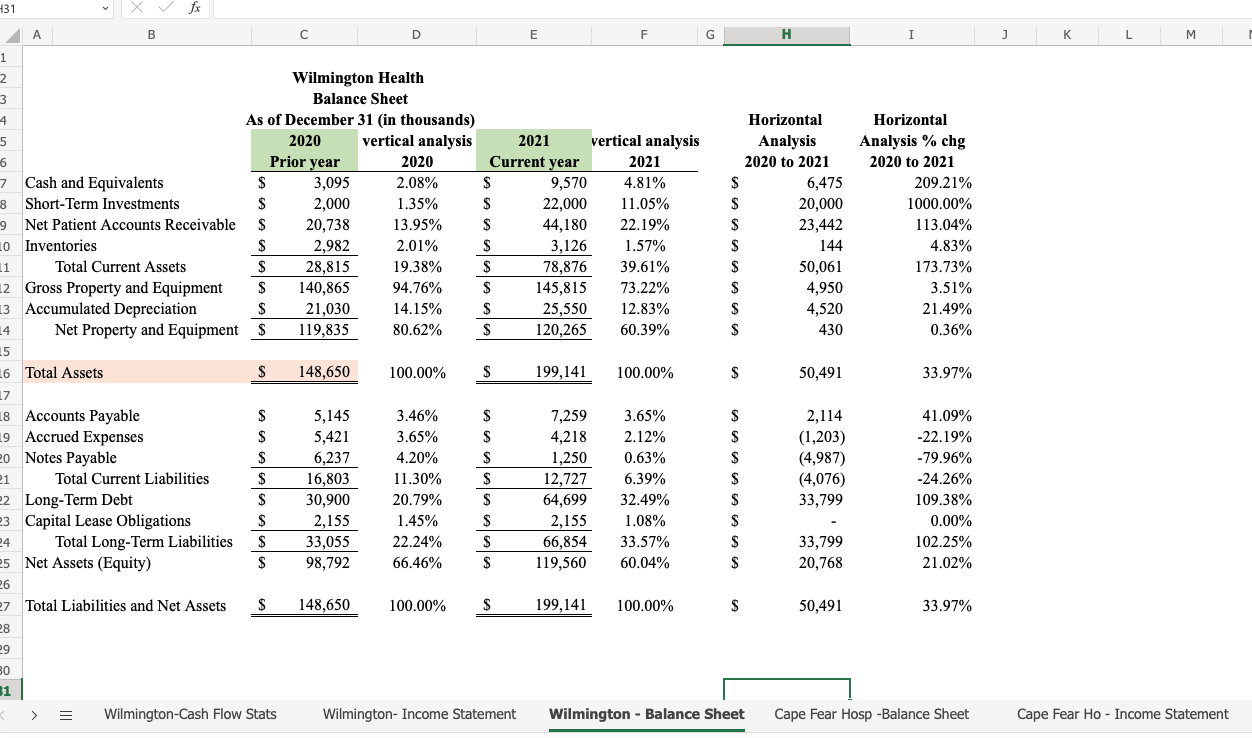
2. What is the Current Ratio for Wilmington Health for 2020 and 2021 respectively?
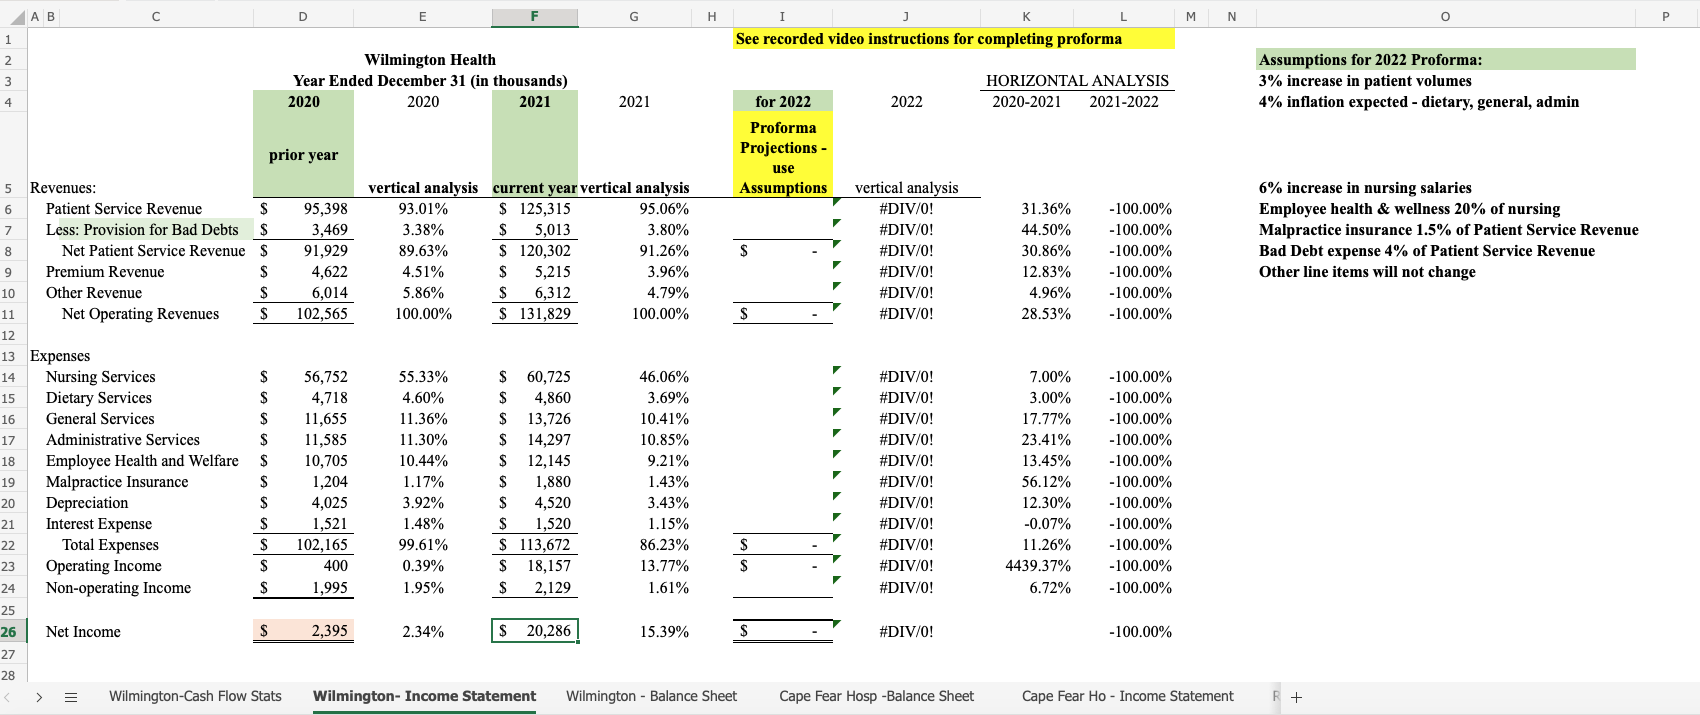
3. What is the Days Cash on Hand for Wilmington Health for 2020 and 2021 respectively?
4. What is the Average Collection Period (Days in Accounts Receivable) for Wilmington Health for 2020 and 2021 respectively?
5. What is the Debt Ratio for Wilmington Health for 2020 and 2021 respectively?
(If you had a problem, with this, remember that Total Debt is the sum of Total Current Liabilities and Total Long-Term Liabilities).
6. What is the Debt to Equity Ratio for Wilmington Health for 2020 and 2021 respectively?
(If you had a problem, with this, remember that Total Debt is the sum of Total Current Liabilities and Total Long-Term Liabilities).
7. What is the Times Interest Earned Ratio for Wilmington Health for 2020 and 2021 respectively?
(If you had a problem with this, it is important to remember EBIT - is Earnings before Interest and Taxes. This means that you must add Interest and Taxes back into the Net Operating Income number.)
8. What are the Fixed Assets Turnover Ratio for Wilmington Health for 2020 and 2021 respectively?
(This problem was a little tricky. For this problem, you had to first calculate the Total Revenues.)


A6 9 10 11 12345678222 B x fx Wilmington Health C D E F G Cape Fear 2020 2021 2022 2020 2021 2022 H ALWAYS USE FUNCTIONS AND FORMULAS - DO NOT COPY/PASTE OR TYPE IN. Profitability Ratios: Total Margin = Net Income / Total Revenue Operating Margin = Operating Income / Operating Revenue Return on Assets = Net Income / Total Assets Return on Equity = Net Income / Total Equity Liquidity Ratios X X Current Ratio = Current Assets/Current Liabilities Days Cash on Hand = (Cash + Short-Term Investments)/ (Expenses - Depreciation) / 365 Debt Management Ratios Debt Ratio = Total Debt/ Total Assets 13 Debt to Equity Ratio = Total Debt/ Total Equity 14 Debt to Capitalization Ratio = Long-Term Debt / Long-Term Debt + Equity 15 X Times Interst Earned Ratio = Earnings Before Interest and Taxes (EBIT) / Interest Expense 16 17 Where to Find the Accounts I Income Statement = IS / Balance Sheet = BS Net Income (IS) / Total Revenues (IS) Operating Income (IS) / Operating Revenue (IS) Net Income (IS) Total Assets (BS) Net Income (IS) / Total Equity (BS) Current Assets (BS) / Current Liabilities (BS) (Cash -BS+ Short-Term Investments - BS) / (Expenses - IS minus Depreciation Total Debt (BS) / Total Assets (BS) Total Debt (BS) / Total Equity (BS) Long-Term Debt (BS) / Long-Term Debt (BS) + Equity (BS) Earnings Before Interest and Taxes (EBIT) - NI (IS) + Interest (IS) + Taxes (IS) Interest Expense (IS) Cash Flow Ratio = (EBIT + Lease Payments + Depreciation Exepense) / (Interest Expense + Lease Payments + (Debt Principal / (1 - Time)) Asset Management Ratio 18 19 20 X 21 23 24 25 26 27 28 29 30 < 2222222222 < Fixed Asset Turnover = Total Revenue / Net Fixed Assets Total Asset Turnover = Total Revenue / Total Assets Days in Patient Accounts Receivable = Net Patient Accounts Recievable/ (Net Patient Service Revenue / 365) Average Age of Plant = Accumulated Depreciation / Depreciation Expense DuPont Equation Return on Equity = Total Margin x Total Asset Turnover x Equity Multiplier Return on Equity = (Net Income / Total Revenue) x (Total Revenue / Total Assets) x (Total Assets / Total Equity) Operating Indicators*** (Not Given) Profit Per Discharge = Inpatient Profit / Total Discharges Net Price per Discharge = Net Inpatient Revenue / Total Dischages Occupancy Rate Inpatient Days / Number of Licensed Beds x 365 Average Length of Stay = Inpatient Days / Total Discharges Inpatient FTEs per Occupied Bed = Inpatient FTEs / Average Daily Census = Wilmington-Cash Flow Stats Wilmington- Income Statement Wilmington - Balance Sheet Total Revenue (IS) / Net Fixed Assets (BS) Total Revenue (IS) / Total Assets (BS) Net Patient Accounts Recievable (BS) / (Net Patient Service Revenue (IS) / 365 Accumulated Depreciation (BS) / Depreciation Expense (IS) Cape Fear Hosp -Balance Sheet Cape Fear Ho - Income Statement Ratios Formula +
Step by Step Solution
There are 3 Steps involved in it
Step: 1

Get Instant Access to Expert-Tailored Solutions
See step-by-step solutions with expert insights and AI powered tools for academic success
Step: 2

Step: 3

Ace Your Homework with AI
Get the answers you need in no time with our AI-driven, step-by-step assistance
Get Started


